
ModRNA products caused the Delta outbreak
The Omicron-based model applies to the Delta variant as well

Short summary void of math
Despite making its first appearance in Portugal in early April 2020, the Delta variant of SARS-CoV-2 only became the most prevalent variant after global deployment of the COVID-19 ModRNA vaccines and was only displaced by the Omicron variant after the booster campaign had been initiated.
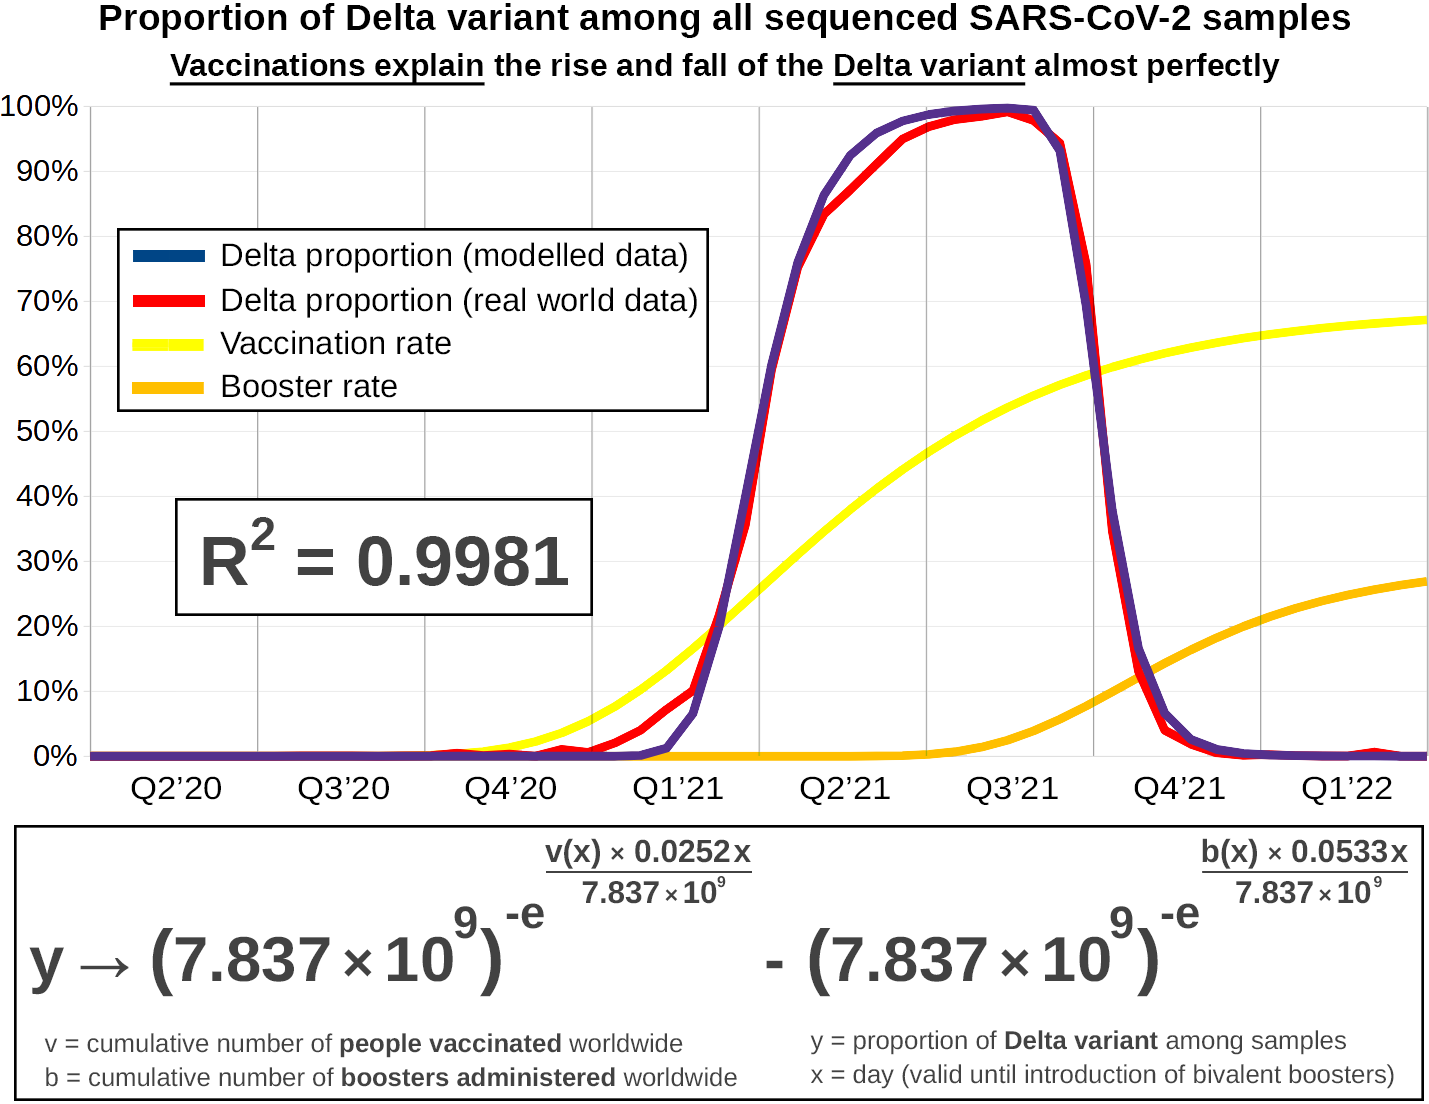
The rise and fall of the Delta variant can be described with high accuracy by a simple model with only two input parameters:
Number of people vaccinated worldwide (expansion)
Number of boosters administered worldwide (displacement)
Summary
The Delta variant of SARS-CoV-2 (B.1.617.2) was first sequenced in Portugal between March 30th and April 5th 2020, but did not become the most prevalent of all circulating variants until one year later.
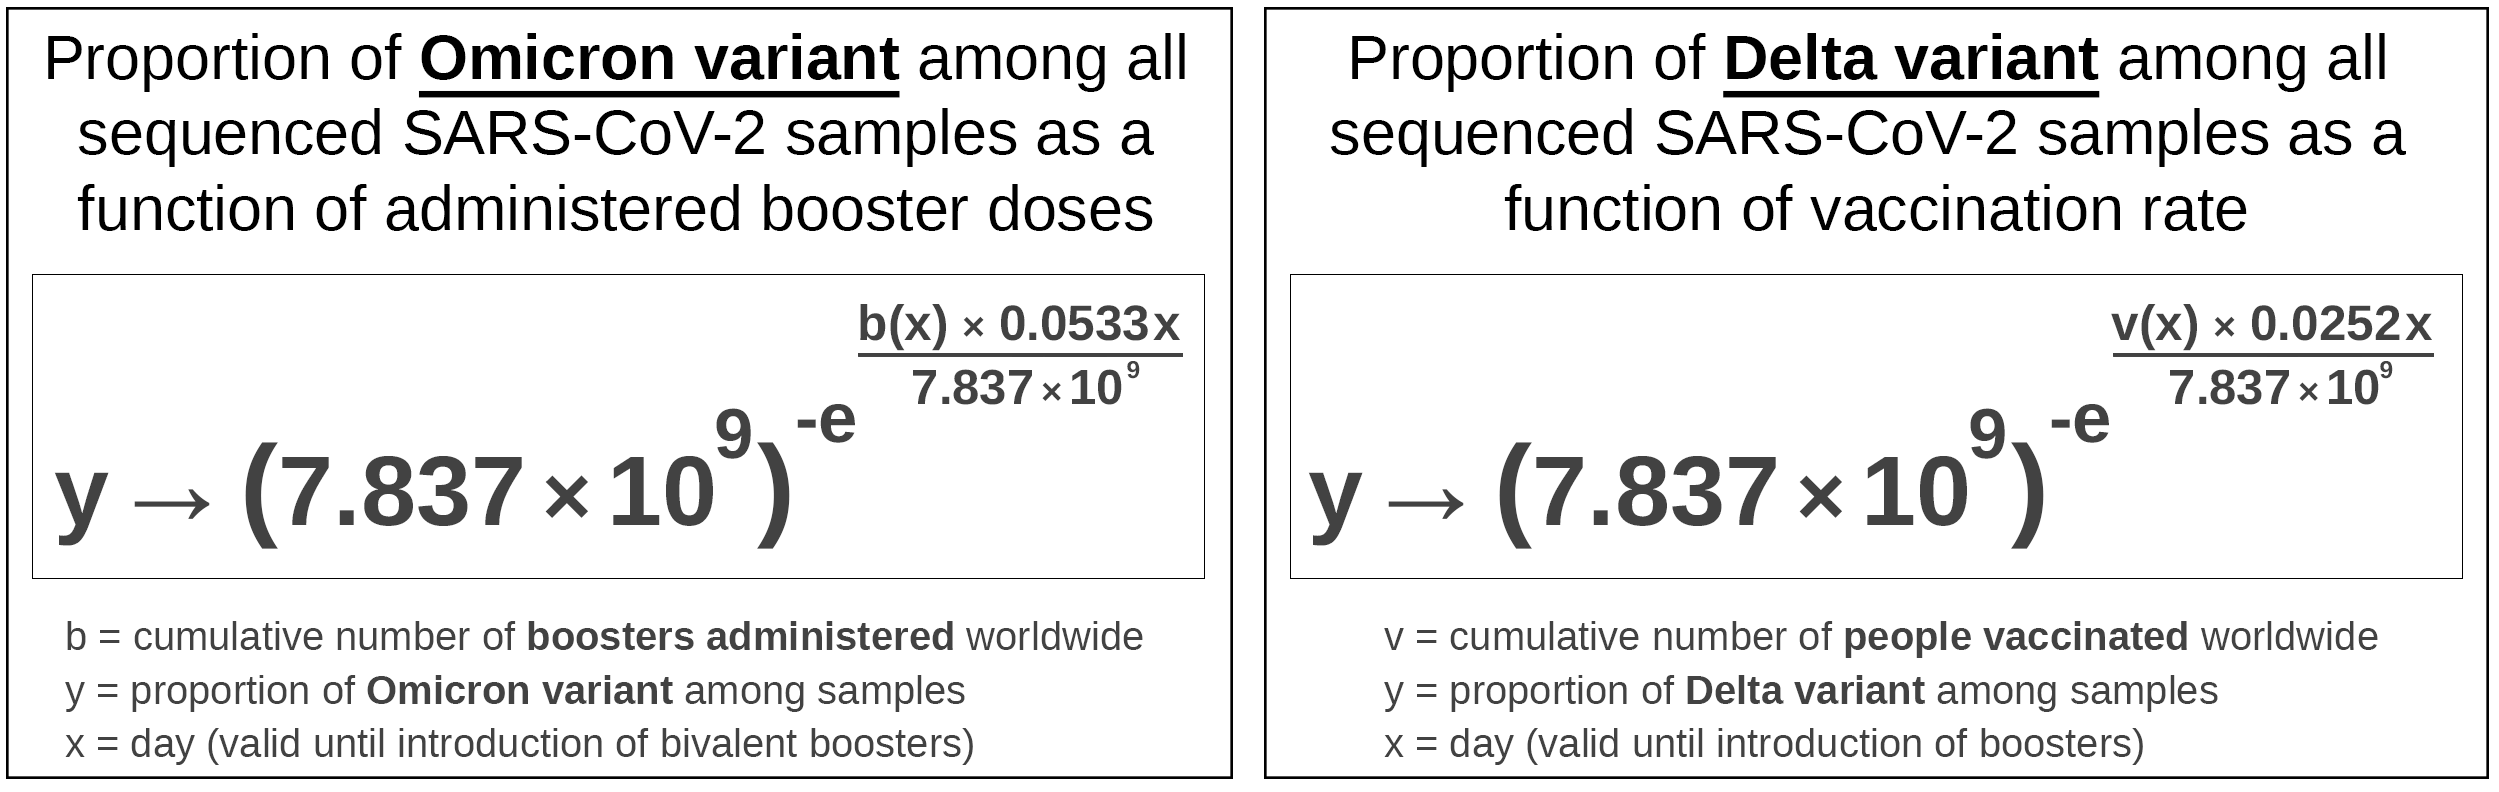
The variant’s increasing relative prevalence as indicated by its proportion among all SARS-CoV-2 samples sequenced worldwide can be explained by a function of the cumulative number of people vaccinated without knowledge of when the index case occurred.
Delta’s displacement was caused by Omicron’s expansion, which is explained by a function of the cumulative number of administered boosters.
The difference between these two functions describes the proportion of sequenced SARS-CoV-2 samples that was positive for the Delta variant across 52 biweekly data points starting April 1st 2020 and ending March 31st 2022 with high accuracy (Root Mean Squared Error 0.000467, R-Squared 0.9981).
The model presented herein eliminates the need for awareness of when the index case occurred. It assumes that the index case of any given variant has always existed, but can only establish predominance over other variants once mass exposition to spike protein via vaccine-vectors causes widespread deceptive immune imprinting.
Introduction
In a previous article I explained that the increase in relative prevalence of the Omicron variant can not be described by a Gompertz function.
Instead Omicron’s expansion can be modelled by replacing the growth constant of a Gompertz function with a linear function of the number of booster doses administered.
No existing epidemiological model explains why the Delta variant became predominant after having been sequenced sporadically throughout the world for the duration of an entire year.
In this article I am applying the model developed for Omicron to the Delta variant, using a linear function of the cumulative number of people vaccinated as growth constant.
Methods
I will use the same methodology to describe how Delta gained predominance that I previously used to explain Omicron’s expansion:
The cumulative number of people vaccinated on each day will be supplied by 'Our World in Data'
If there are any reporting delays, they will be corrected
The proportion of vaccinated people worldwide serves as a replacement of the growth constant in a Gompertz function
The result is the modelled proportion of the Delta variant among all sequenced SARS-CoV-2 samples
The model’s accuracy will be determined through a simple linear regression analysis against real world data supplied by 'Our World in Data'
Data Sources
Downloads
Results

This is the data supplied by 'Our World in Data'. You can clearly see how steps are forming on each day accumulated data was released.
Instead of redistributing the accumulated vaccinations in order to approximate the true figures, 'Our World in Data' declares them all as vaccinations that happened sometime in the past. This is possible because 'Our World in Data' is displaying the cumulative number of people vaccinated instead of the number of people newly vaccinated.
The corresponding daily data representing the number of people newly vaccinated can be derived from these data.

The vaccination campaign was at its peak a few weeks after the large spike at the beginning of the third quarter of 2021. The number of people newly vaccinated per week should be rising steadily up to that point. Instead we can see a phase of decline in the 2nd quarter of 2021.
'Our World in Data' clearly misrepresents the true figures. I constructed a sigmoid function representing the probable number of cumulative doses that were administered in daily resolution.

The results are displayed below.
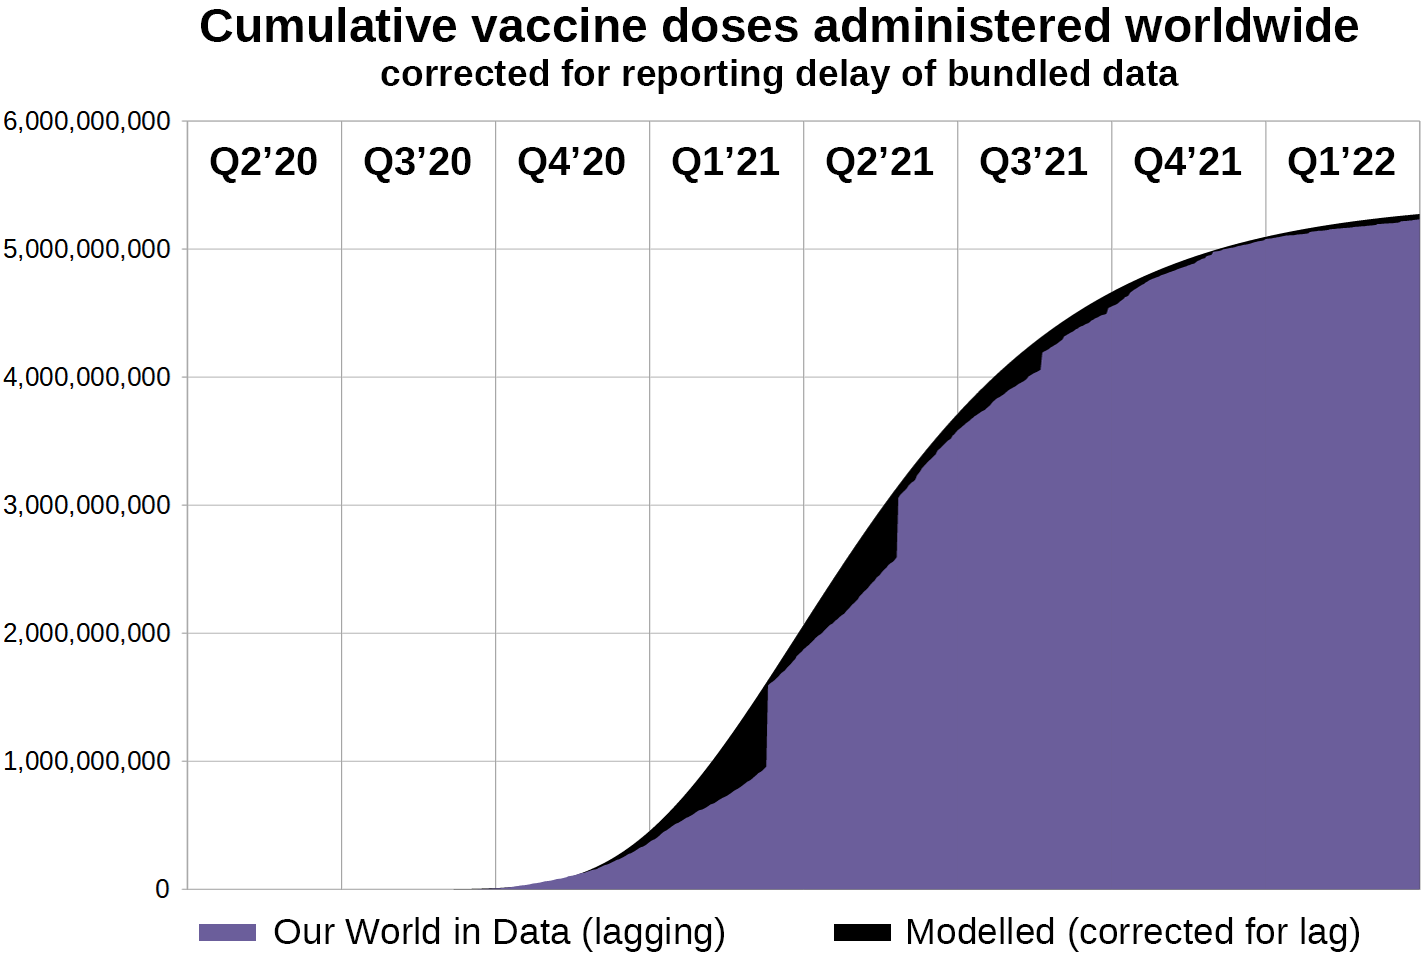
Compared to the raw vaccination data supplied by 'Our World in Data' the modelled vaccination data is much closer to what I would expect to see when data from 200 different locations is bundled into a single time series.
I used the result to construct another function that represents the Delta variant’s proportion among all sequenced SARS-CoV-2 samples worldwide, based on the function used to describe Omicron’s expansion.
We can plot both of these functions and display the respective vaccination rate on the same chart.


Since the Omicron variant displaced the Delta variant, we can subtract Omicron’s relative prevalence from Delta’s relative prevalence to calculate the Delta variant’s relative prevalence over the entire course of two years.


For comparison with the real world variant data supplied by 'Our World in Data' the data has to be reduced to biweekly resolution.

Looking at the plotted real world data we can see the relative prevalence of Delta increase in early 2020 before the modelled prevalence catches up about 8 weeks later.
I plotted all value pairs of modelled and real world data onto a scatter chart, ran a simple linear regression analysis on the two time series and determined the Root Mean Squared Error.

Conclusion
My comparison of real world and modelled data over 52 pairs of biweekly data points resulted in a Root Mean Squared Error of 0.0467% (R-Squared 0.9981), which means the model predicts both the path towards the Delta variant’s predominance and the period of displacement by the Omicron variant that followed very well.
Discussion
The modelled data fits the real world data almost perfectly.
The largest relative discrepancy between the two time series can be observed in the first quarter of 2021 during the Delta variant’s initial phase of exponential expansion.
This could be explained by a large number of unreported vaccinations occurring during 2020 and the first two months of 2021:
The modRNA products were in high demand during that time and possibly illegitimately being administered to people not yet eligible
Clinical trials were performed in 2020. The doses administered in these trials are not included in our dataset
What’s next
I will try to acquire data for the number of bivalent boosters administered in order to find out if my model can accurately describe the XBB outbreak that is currently taking place around the world.
I am planning a short article explaining the pathophysiology of deceptive immune imprinting
An article discussing how new cases correlate with the number of newly administered doses and how 'Our World in Data' is further distorting the temporal relation is also planned
Before I can get around to any of the above, I want to post an update on German mortality data, since the preliminary all-cause mortality data for the entire year 2022 was released today (January 10th 2023)
Very impressive!
The discrepancy in the first quarter of 2021 might also be explained by the changing vaccine mix (larger proportion of J&J and AZ first, later on more mRNA).
And the just-released German mortality data is remarkable indeed (with qualification: not for all age groups).
Awesome post! I did something similar on a MUCH smaller scale as it pertains to Grenada.
http://winduprubberfinger.com/blog1.php/2021/09/18/grenada
It was interesting, because the COVID case rate was low, until people started getting vaccinated. Then it skyrocketed.