German excess mortality (Part 2)
A choice between plague and cholera
Disclaimer
When I use the term “acute toxicity” I am referring to all adverse events occurring under exposure of either a modRNA product itself or its translated payload, the spike protein.
Short non-technical summary
German federal lands with the highest booster rates see the highest rates of excess deaths during times of low COVID-19 mortality, but lower rates of excess deaths than other federal lands during times of high COVID-19 mortality.
The correlation between excess mortality and booster rates is becoming stronger over time, because vaccine efficacy has been decreasing with every new variant that gained predominance, while the modRNA products’ negative impact on health is unaffected by time.
Acute toxicity does not explain the high non-COVID excess mortality of 2022.
I estimate that roughly 1 in 2000 vaccinees died from acute toxicity caused by the vaccine products in 2021, but the evidence is inconclusive.
Summary
During 2021 and 2022 the Pearson correlation coefficient between weekly excess deaths and booster rates across German federal lands ranged from -0.858 to 0.807.
The correlation is strongest during times of low COVID-19 mortality. A high number of weekly COVID-19 deaths weakens the correlation, presumably due to - please don’t stop reading here - the protective effects of the modRNA products against severe disease and death.
Vaccine efficacy has been decreasing continuously since early 2021, hence the correlation between excess deaths and booster rates has grown stronger.
The net impact of vaccinations on mortality was negative in 2021 (they prevented more deaths then they caused deaths), but positive in 2022 (they caused more deaths then they prevented deaths).
Acute vaccine toxicity could entirely explain non-COVID excess mortality of 2021 and January 2022, but we lack conclusive evidence. The high excess mortality rates of 2022 can not be explained by acute toxicity of COVID-19 immunization products.
Introduction
This is the second part in a series of articles dedicated to the soaring German mortality figures of 2022.
Summary of "German excess mortality (Part 1)"
The first article in this series gives you an overview of both national German mortality data and mortality data of all 16 federal lands for the past 13 years.
It contains a large number of charts displaying mortality, trend-corrected mortality, average (seasonal) mortality and excess mortality figures of all federal lands for 2010-2022. These charts are well worth looking into if you want to gain an impression of the situation in Germany.
I concluded that German excess mortality in 2022 was not only exceptionally high, but also distributed in a highly unusual pattern.
They say a picture is worth a thousand words, so instead of explaining what is so unusual about it, I will show you an image displaying the excess mortality of my home state Schleswig-Holstein for 2019, 2020 and 2022.
2019 was an average year without flu epidemic during which excess mortality ranged around 0%
2020 saw a deficit in mortality compared to previous years
2022 is off the charts with excess mortality rising steadily towards 25% over the course of the year
Schleswig-Holstein has a population of 2.897 million, so the current level of mortality translates to 1 in 500 people within my Heimat dying unexpectedly per year.
Seeing this brings tears to my eyes. Time and time again these people were promised better health if they just complied with whatever was being asked of them.
What’s killing my people?
I have identified multiple factors contributing to the increase in mortality. In this article I will shine a light on the direct impact the modRNA products are having on German mortality by looking at data supplied by the German Federal Statistical Office and the German public health institute RKI.
Methods
Indicator of net vaccine impact
I am using the Pearson correlation coefficient between weekly excess mortality and final booster rate across German federal lands as an indicator for the impact COVID-19 vaccines have on mortality. This indicator will be plotted over the entire course of the past two years in order to gain an understanding of how booster rates and excess mortality relate to one another.
Booster rates by federal land
Data for boosters administered in each federal land per day are being released by the Robert-Koch-Institut, but the data do not reflect the vaccination rates within the federal lands due to commuters often getting their shots outside of the land they reside in.
The data representing actual vaccination rates within each federal land that are made available are only regularly updated snapshots. This is a barrier for data snoopers like me to correlate doses per day with excess deaths directly.
Instead of trying to synthesize the data from older file versions which would have required downloading 100GB of zip archives from github, I only used some of the older file versions to make sure those federal lands with the highest rates of quadruple-vaccinated individuals as of today are also the ones which were leading in vaccinations in the early phase of the vaccination campaign.
Excess mortality
My method of calculating excess mortality was discussed in the first article of this series.
Data Sources
Preliminary mortality 2016-2022 (German Federal Statistical Office)
Final mortality 2010-2015 (German Federal Statistical Office)
Results
Plotting the Pearson correlation coefficient
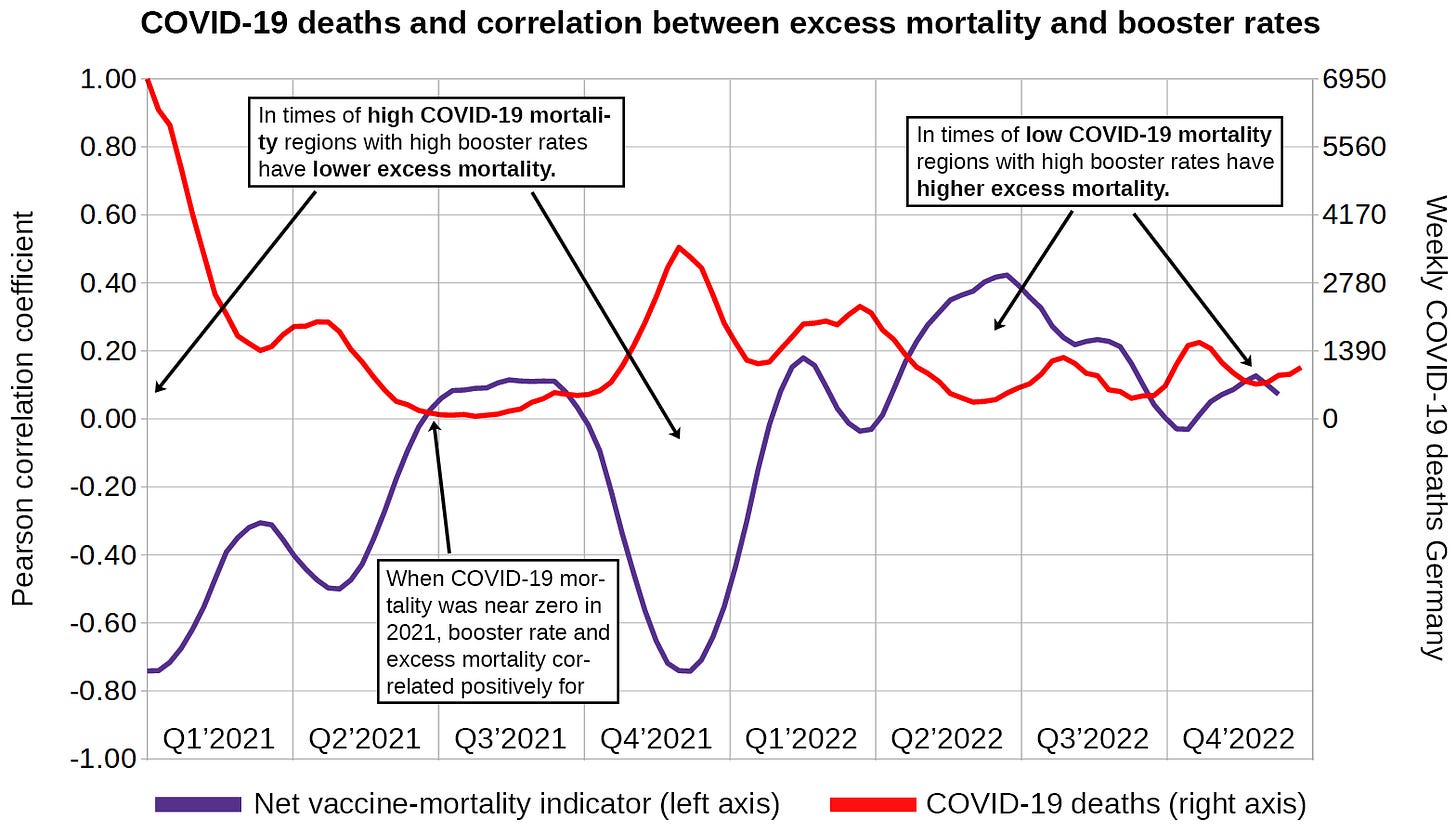
I plotted the Pearson correlation coefficient between weekly excess death and booster rate over the course of two years (2021-2022).
What are we seeing here?
The blue lines represent the Pearson correlation coefficient over time
Whenever the correlation is positive those federal lands with high booster rates tend to have higher excess mortality rates than other regions
Whenever the correlation is negative those federal lands with high booster rates tend to have lower excess mortality rates than other regions
The red line represents the general trend of the Pearson correlation coefficient over time
The upward slope indicates that over time the beneficial effects of the products on mortality rates are diminishing in relation to those effects that increase mortality
The turning point - the point in time when the health hazards started outweighing the health benefits - occured in the first quarter of 2022, right around the time Omicron became predominant as a result of the booster campaign
Times of high correlation, times of low correlation
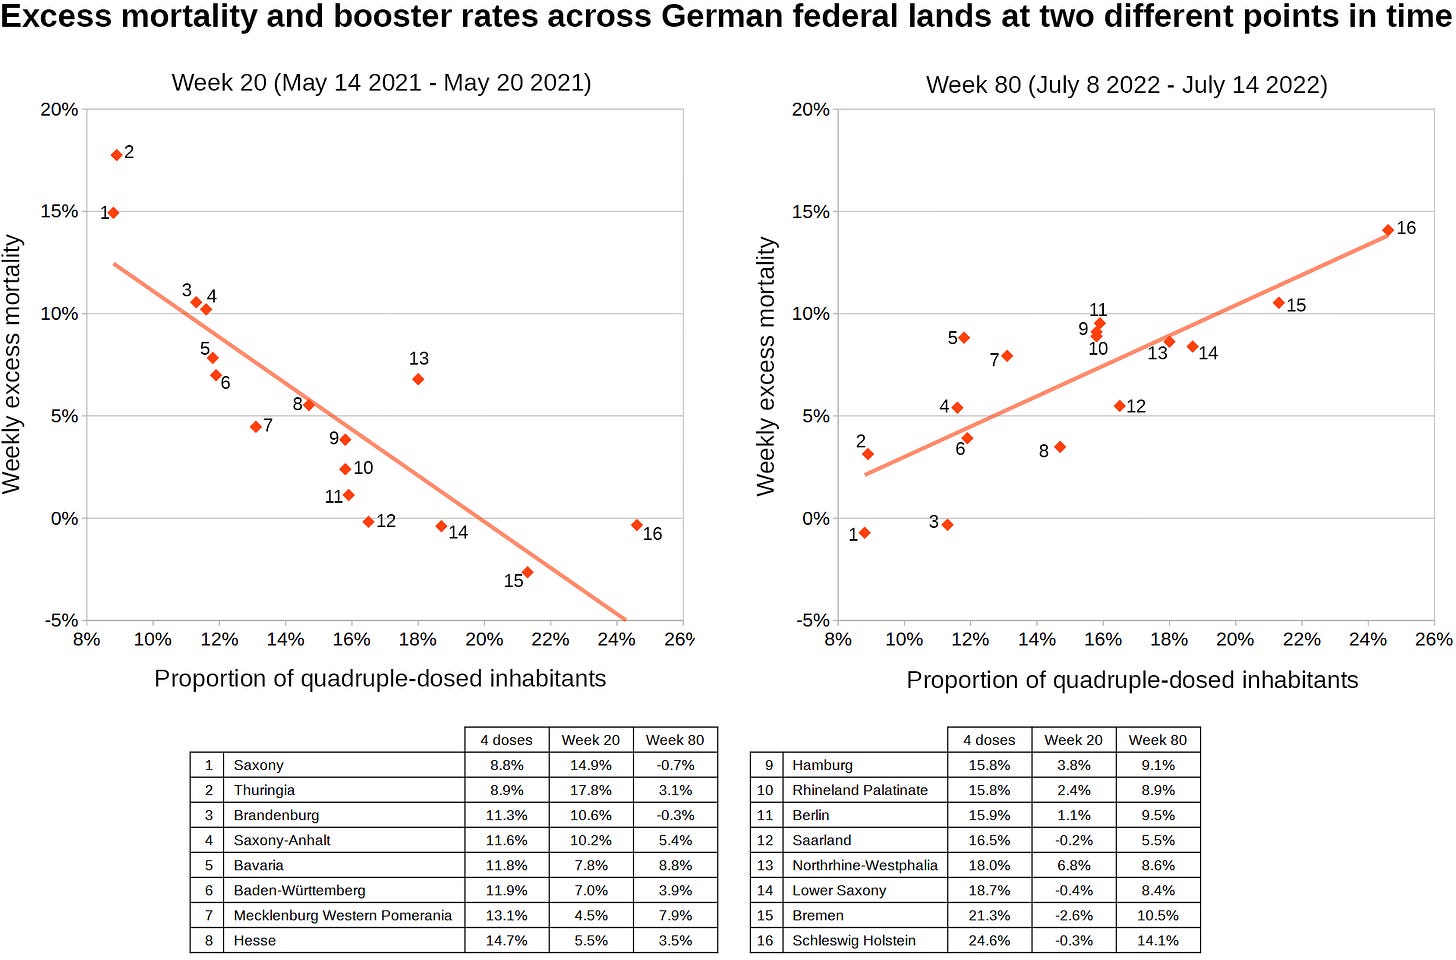
I decided to create two scatter charts for those two weeks during which the correlation is at its maximum and minimum respectively.
Apparently boosters were at times associated with low mortality, while during other times they were associated with high mortality.
COVID-19 deaths and net vaccine impact
I plotted the indicator for the vaccine’s impact on mortality next to the number of weekly COVID-19 deaths occurring nationwide.
The vaccines still seem to elicit some type of protective effect against COVID-19, but there is a clear upwards trend in the correlation between excess deaths and vaccination rate.
New vaccinations and new deaths
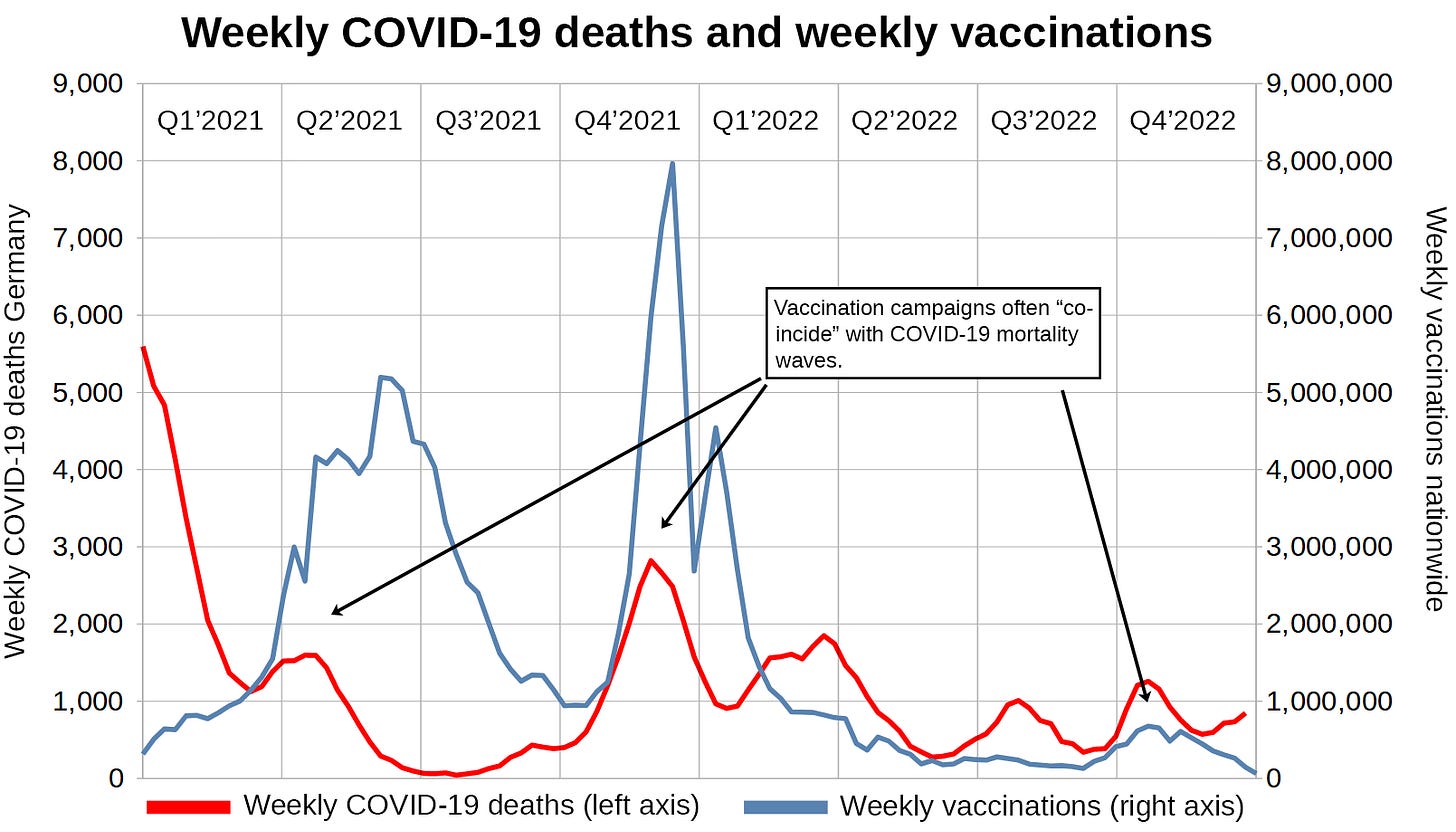
I wanted to find out whether or not new vaccinations are visibly represented in mortality data.
Unfortunately I had to find out vaccination campaigns are often timed to “coincide” with COVID-19 mortality. This means that any excess mortality caused by the vaccines could just as well be attributed to COVID-19 or insufficient hospital capacities.
Non-COVID excess mortality
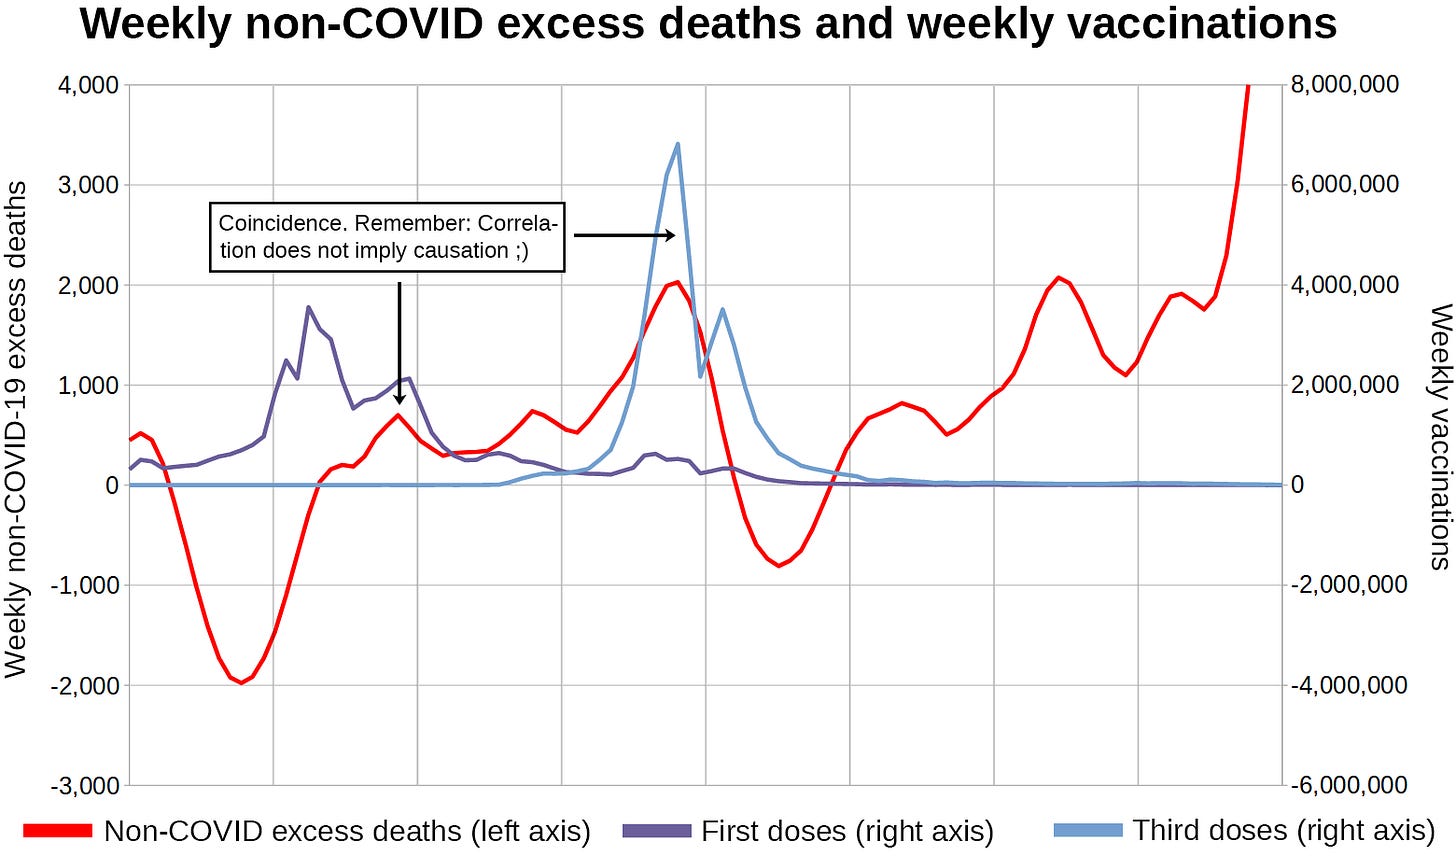
In order to get a better picture, I decided to plot non-COVID excess mortality. I use the same basic method that I used to determine excess mortality in the first article of this series, but will display the result in absolute numbers instead.
I previously divided trend-corrected mortality by the average the seasonal mortality, but this time I subtract seasonal mortality from trend-corrected mortality.
Instead of excess mortality being expressed in percentage points relative to the average mortality of each week throughout the past years, it is expressed as the absolute number of deaths per week above average mortality.
Since I am only interested in how mortality relates to newly administered vaccine doses, I cut off the time before introduction of the vaccines.
We can display this next to vaccine doses. The RKI offers data stratified by dose series. I plotted dose series 1 and 3 next to non-COVID excess deaths.
It looks to me as if 1 in 2000 Germans who were vaccinated against COVID-19 with dose series 1 or 3 died within days of receiving their dose.
Let’s see if this explains the mortality of 2022 by looking at dose series 4-6.
Strangely enough, booster campaigns still coincide with mortality waves, but looking at the numbers tells me but they’re not the direct cause of the excess mortality. That does not mean booster campaigns aren’t causing these deaths, just not directly.
Discussion
Correlation of excess deaths with vaccination rate
I can not deny that I was biased towards blaming acute toxicity from the modRNA products for the excess mortality of 2022. However I always do my best to look past any biased expectations I might be falling victim to.
Doing just that lead to the - admittedly very surprising and slightly painful - realization that the modRNA injections I had warned everyone about seemed to have been quite effective at reducing COVID-19 mortality - at least for a very brief period of time.
Without admitting this I could not have understood why the correlation between excess mortality and booster rates is not as strong as I had anticipated and why deployment of these vaccines is still the greatest crime in the history of mankind, but we will get to that in the next article.
The true net impact of the modRNA products on mortality is still occluded by their last bit of remaining efficacy against the disease.
Acute toxicity
If I was herewith to claim that 1 out of 2000 vaccinees died shortly after receiving their injection, I would be met with three points of criticism:
Correlation does not imply causation
There were concurrent COVID-19 waves
The deaths would have fallen into a period of negative excess all-cause mortality
Don’t get me wrong, there is not a doubt in my mind that millions of people worldwide died from acute vaccine toxicity during a time of mortality displacement. However it would be very tedious to argue on this level.
I may get to this at a later time, but it seems enough people have become fully aware of the direct toxicity elicited by the vaccines by now. I am hoping the courts will somehow settle this to the consolation of the victims’ families.
Conclusion
Acute vaccine toxicity caused a large share of the excess mortality in 2021
Acute vaccine toxicity caused very little excess mortality in 2022
Vaccination campaigns are timed to peak when COVID-19 deaths peak. This means:
Deaths caused by acute toxicity are hidden underneith COVID-19 deaths
Because COVID mortality was lowered by vaccine deployment, the correlation between vaccination rate and excess mortality is only moderately strong
What’s next?
This article series is dedicated to what happened in 2022. Since barely any vaccinations were performed in 2022, we can not blame the mortality figures on acute toxicity.
In the next article I will explain why I think that the entire German excess mortality of 2022 is caused by COVID-19 sequesters and how modRNA products made it possible.
Footnotes
I abstained from displaying the death figures for Schleswig-Holstein in 2021, because I wanted to demonstrate what average years look like, which 2019 and 2020 were. 2021 however is a very unusual year in terms of mortality. Over 150 million vaccine doses were administered in Germany that year and the “Delta wave” came into full swing. If you are interested in the figures for 2021, please refer to the first article in this series.







This is a lot of work and good data to build on.
I think there's one point for improvement. "Acute toxicity" is a very narrow view within the hundred other ways that these molecular combinations can eventually cause death. By focusing on this terminology, you risk having an audience not familiar with the breadth of Spike pathology misuse your work to say that "little (observable) *acute* toxicity" = "not harmful".
Falling into this trap is what pharmaceuticals / regulatory agencies have historically relied on in order to define "safety": if it's not a gunshot with death 30 minutes later, then it is defined as "safe" (think of the historic battles to have tobacco / asbestos danger acknowledged).
In our case, it is already well established in the medical literature that a great number of organs and cell types are targeted by the Spike motif and therefore for immune attack and eventual destruction. This takes time – it won't be acute, but it may be debilitating and deadly – something that your data may be showing us if we stop focusing on "acute".
For this reason, you may consider rewording some of these points here so that conclusions are not drawn prematurely.
I agree that excess mortality in 2022 can not have been caused by acute toxicity alone, but it might still play a significant part. Around 92% of deaths have occurred in the 60+ age group. In this group, 38% have had four or more jabs, and basically all of these have been dealt out in 2022.