
German excess mortality (Part 1)
German excess mortality by federal land

Update
German excess mortality has increased further from 26% in week 49 to 33% in the last week of 2022.
There were 6832 excess deaths in week 52, up from 3676 excess deaths in week 49, which is an increase of 86% within 3 weeks.
The national charts were updated accordingly, but federal lands are still missing data for the last 3 weeks of 2022.
Summary
Instead of following the typical U-shaped pattern associated with respiratory infectious disease mortality during the winter months, German excess mortality has been increasing steadily across German federal lands throughout 2022.


Introduction
This is the first part in a series of articles dedicated to the soaring German mortality figures of 2022.
Since my first article on the correlation between German booster rates and excess mortality German mortality has been increasing further with the national excess mortality rate reaching 26% in the last reporting week and excess mortality rates across the 16 German federal lands ranging between 3% and 43%.
While such increases are not unusual during winter time, there is something extraordinary about the German data. Instead of following the typical U-shaped pattern attributed to seasonal respiratory infectious disease, excess mortality has been increasing steadily throughout 2022.
While we will take a closer look at what is causing the excess mortality in future articles, this one will be purely descriptive.
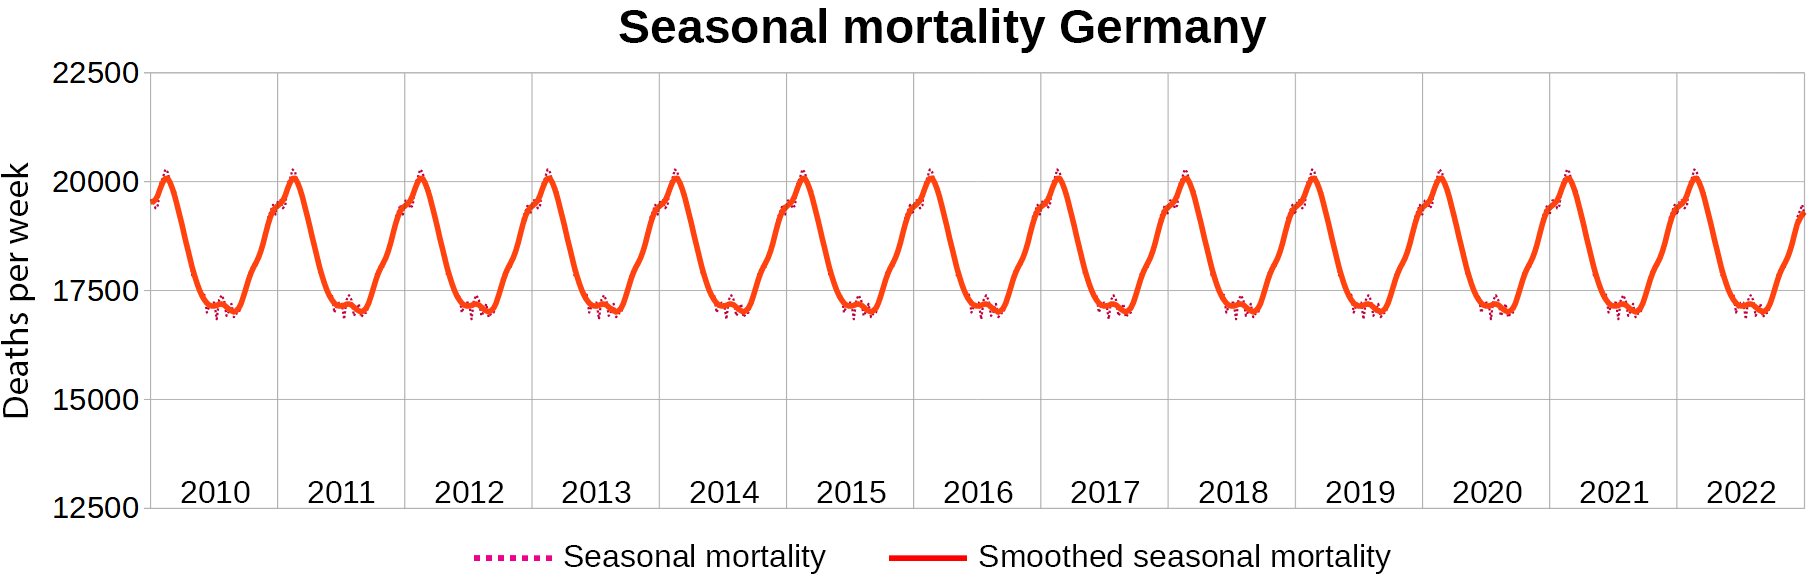
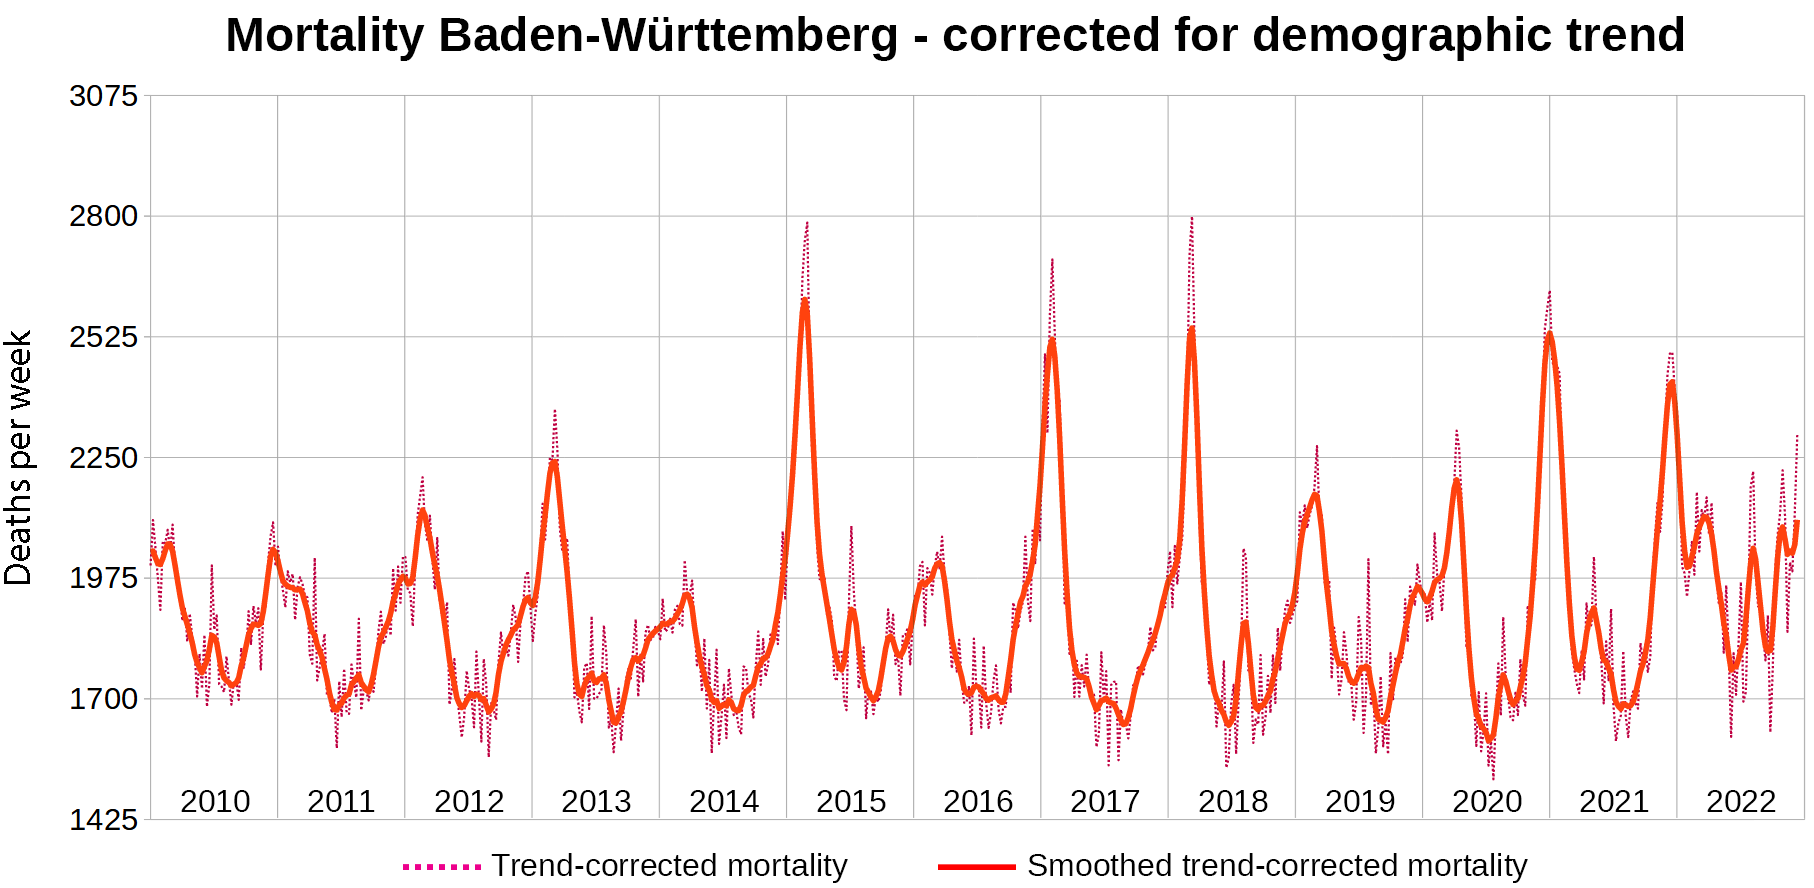
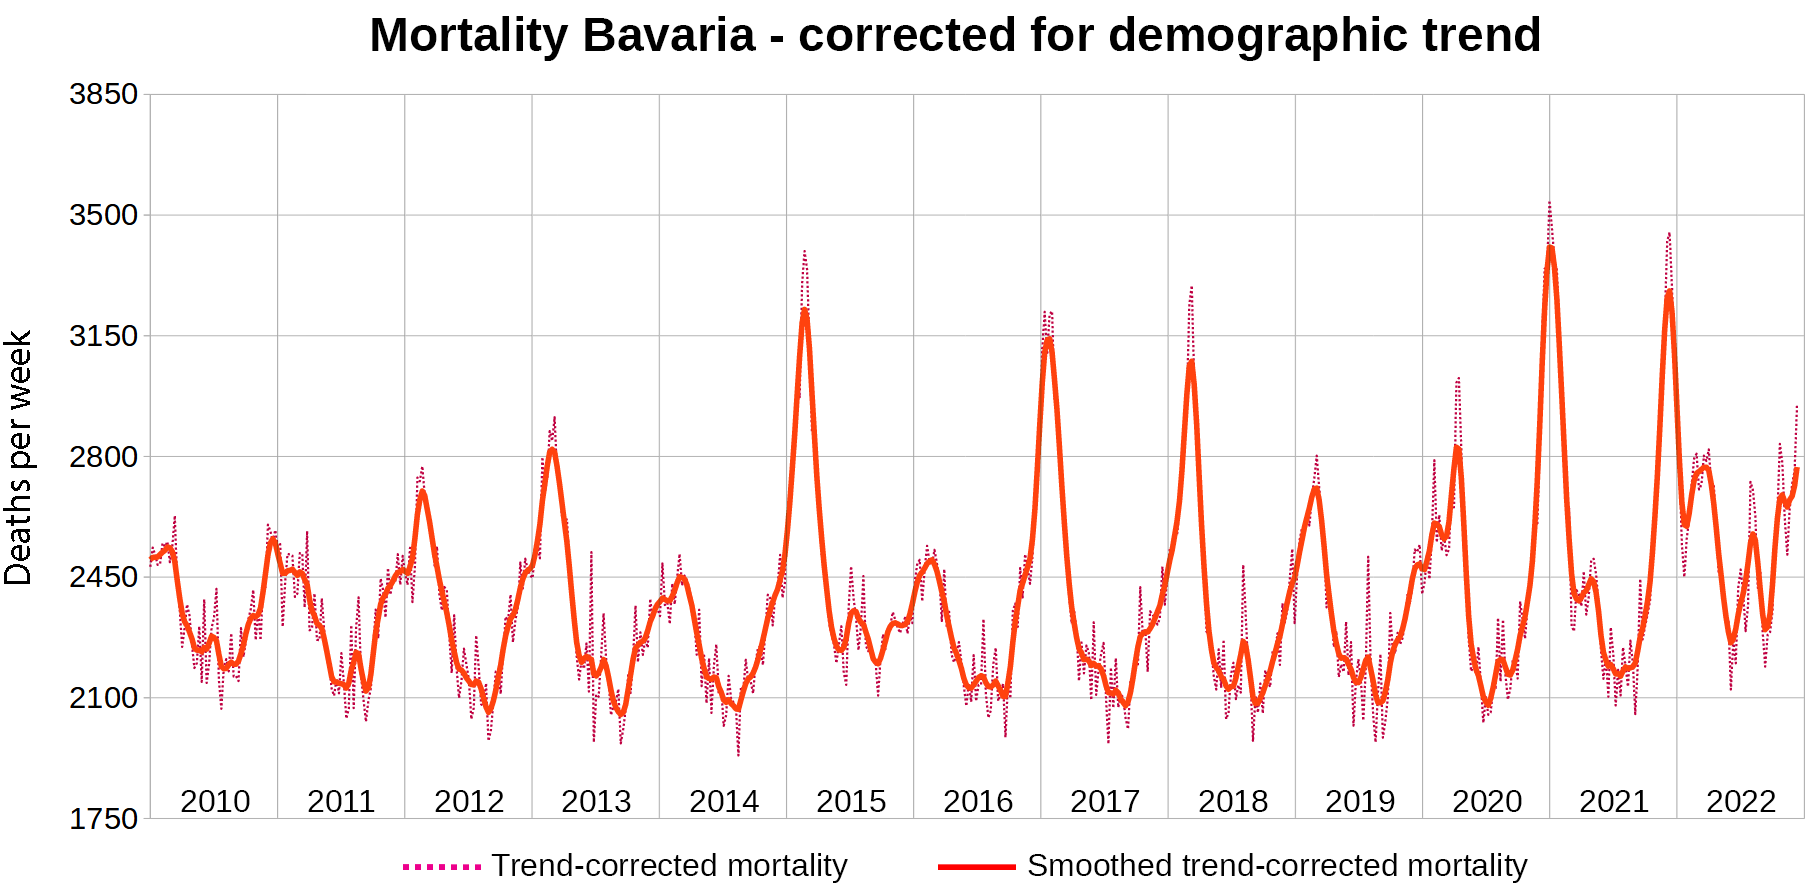
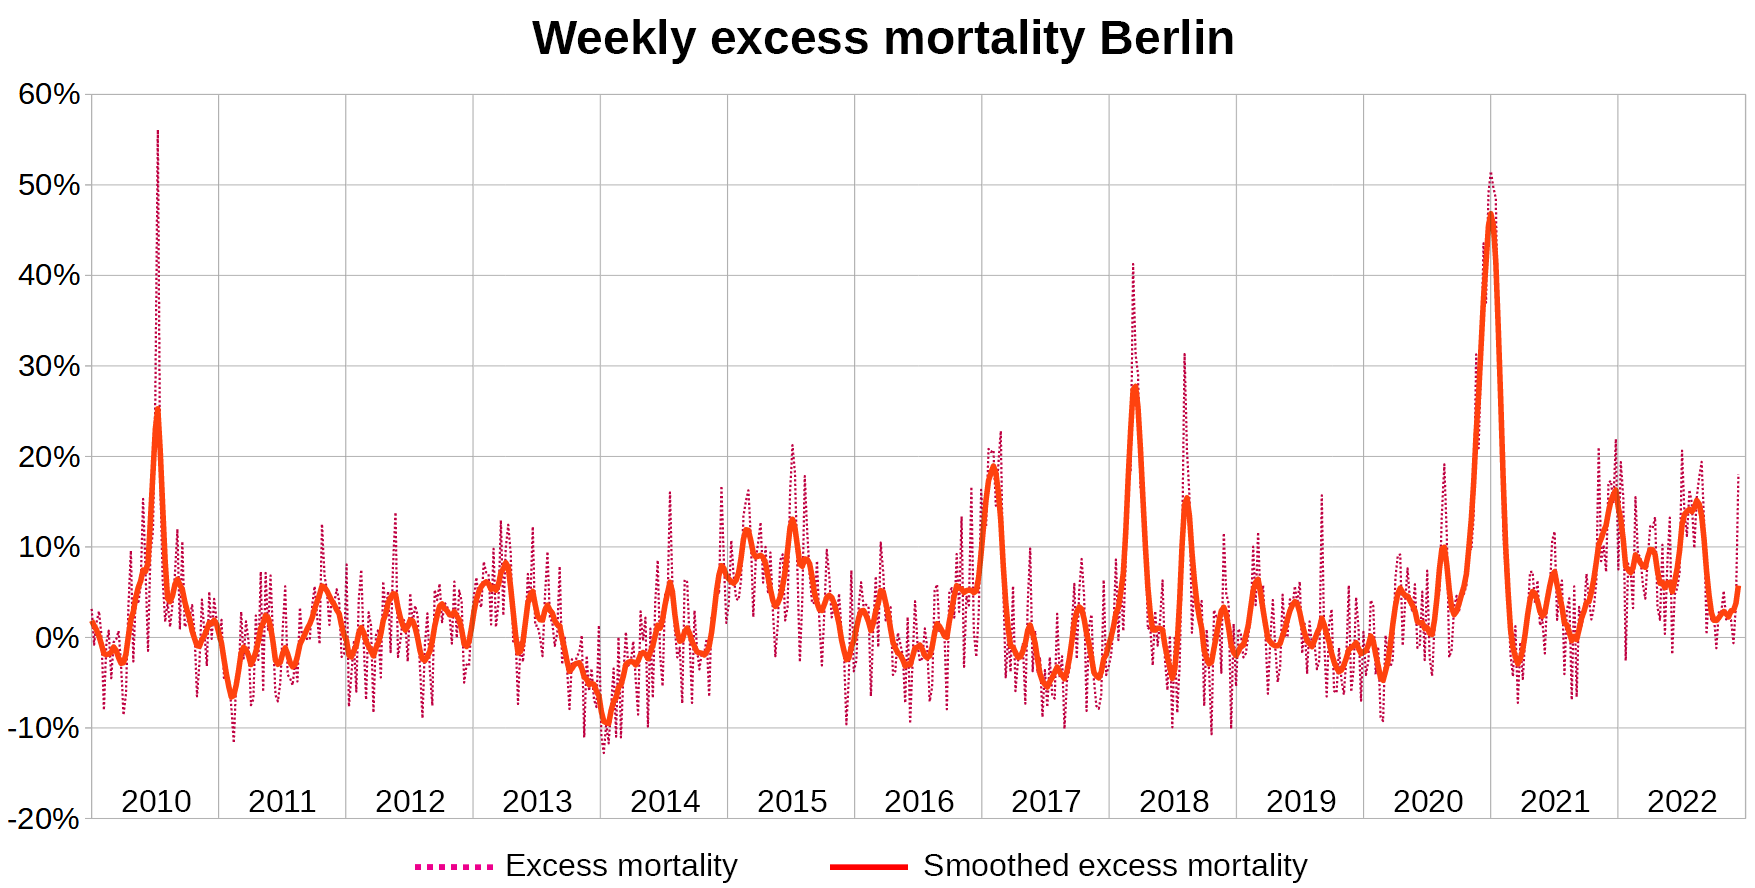
I am presenting a series of charts displaying mortality, trend-corrected mortality, seasonal mortality and excess mortality for the years 2010-2022 both for nation-wide figures as well as for all 16 federal lands.
Methods
German demographics
Because the mean age of the German population has been increasing for decades, mortality has been on the rise. In order to be able to compare the years 2010 through 2022 directly it is therefore necessary to correct for this trend.
German demographics are unusual for several reasons:
World War II caused very high mortality which is still reflected in the highest age tiers
The poverty created during World War II resulted in a period of low post-war birth rates which stood in stark contrast to the period of high fertility that occured in the late 1950s and 60s
Germany is a nation rich in immigrants. People born abroad made up more than 10% of the German population in 2014. Since then the nation has seen an influx of around 400,000 immigrants per year on average
With the replacement rate generally being put at 2.1 births per woman, German fertility is among the lowest in the world, amounting to only 1.5 children births on average per woman. According to a widespread collective delusion this is a sign of prosperity.
German population is as far from being standard as the population of an industrialized nation could possibly be and reliable census data revealing the current age structure is not available, which is why I decided not to adjust the data to WHO standard population.
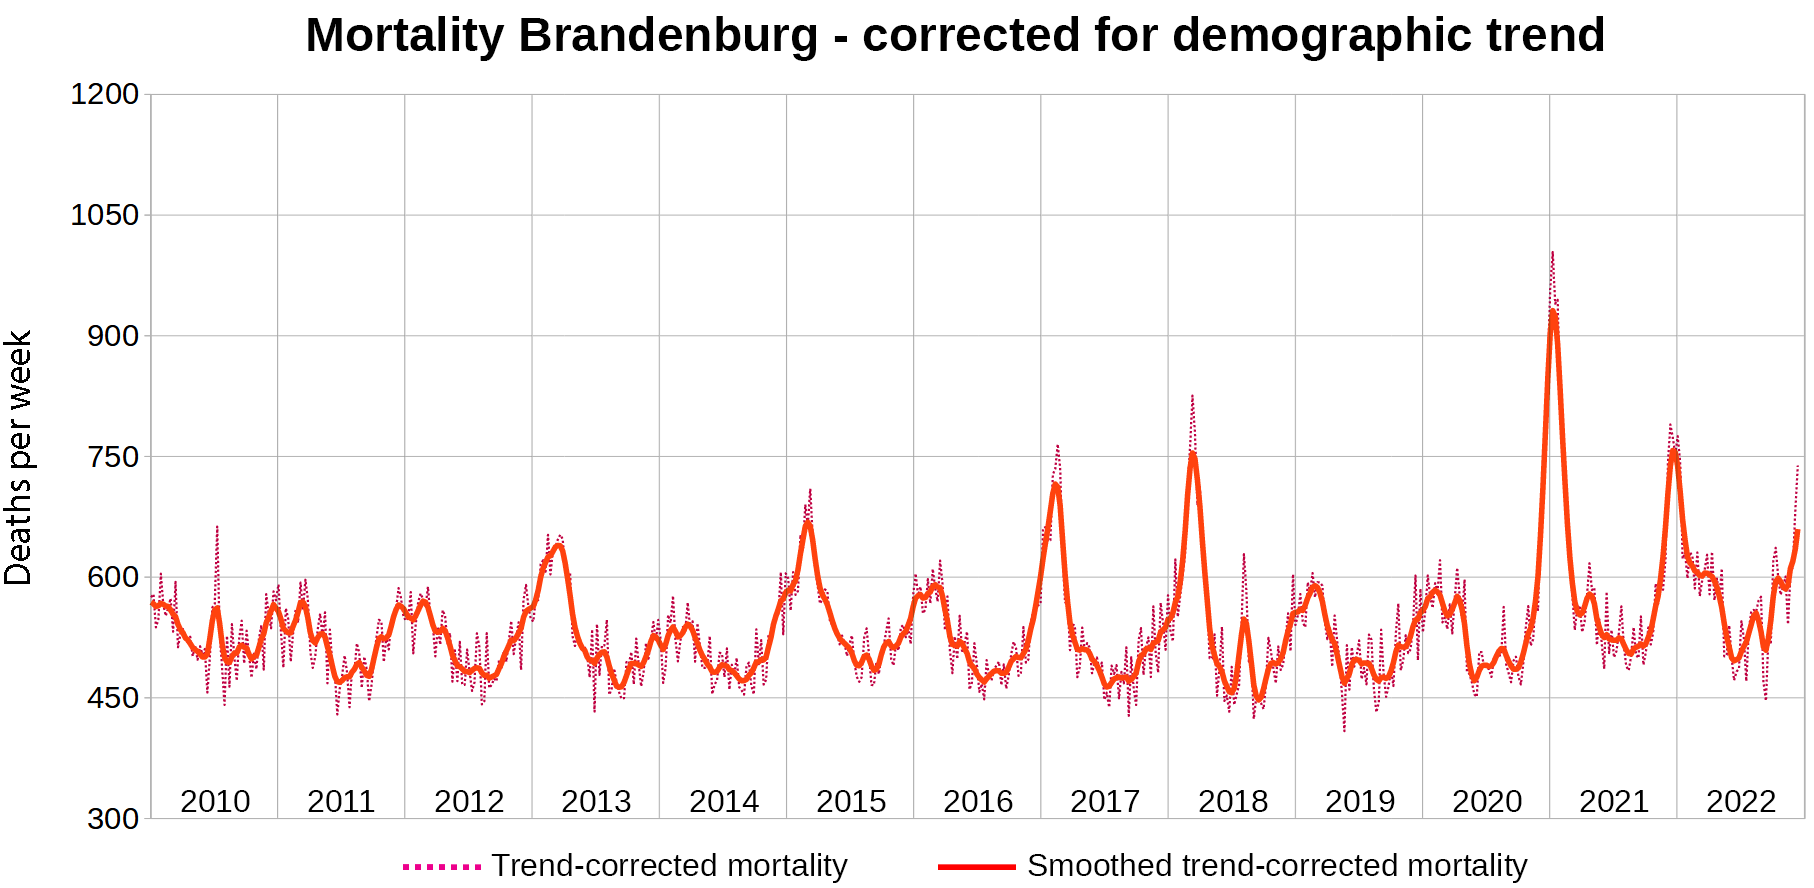
Instead I corrected mortality for the long term trend occurring during the reference timeframe of 2010 to 2019 which I assume to be linear.
Data sources (Federal Office of statistics)
Calculation of excess mortality
All years spanning over 53 calendar weeks are stretched to 52 weeks
The linear trend between 2010 and 2019 is then calculated and subtracted from the data
Expected seasonal mortality is determined from the average weekly mortality between 2010 and 2019
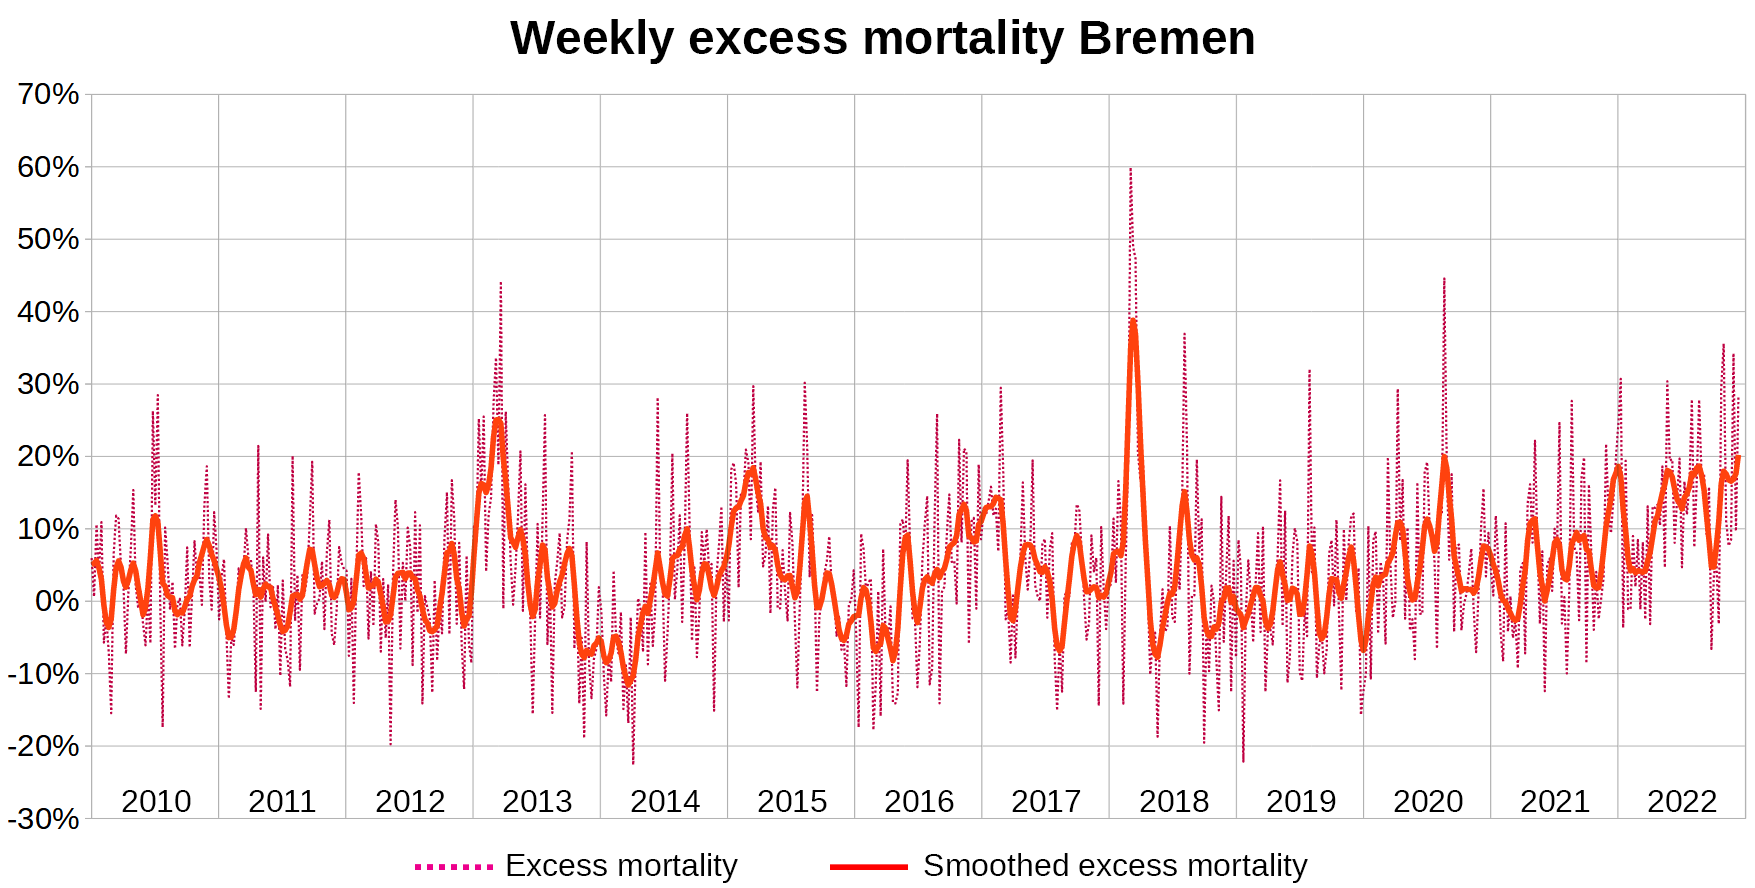
Weekly mortality is then divided by the expected seasonal mortality to yield the relative excess mortality
Downloads
Since I am not discussing the reasons for the rising German mortality in this article, there will be no conclusion section. Instead I will give you an idea what to expect from future articles in this series. Since the result section consists of almost 100 pictures, I moved the “What’s next?” section to the top.
What’s next?
While the German media is still trying to put the blame on climate change and infectious disease, I am intending to do a thorough analysis which is more than warranted, given that the numbers we see suggest that Germany might be on the brink of a humanitarian crisis.
So far I could make out several factors contributing to the rising German mortality:
Lack of medical care due to closure of hospitals
Mortality directly caused by COVID-19 modRNA products (affecting the vaccinated)
Mortality indirectly caused by COVID-19 modRNA products (affecting both the vaccinated and the unvaccinated)
I intend to shine a light on each of these mechanisms in future articles of this series.
Results
2022 All German federal lands

2020-2022 Germany & all German federal lands


2010-2022 Germany


2010-2022 Baden-Württemberg


2010-2022 Bavaria


2010-2022 Berlin


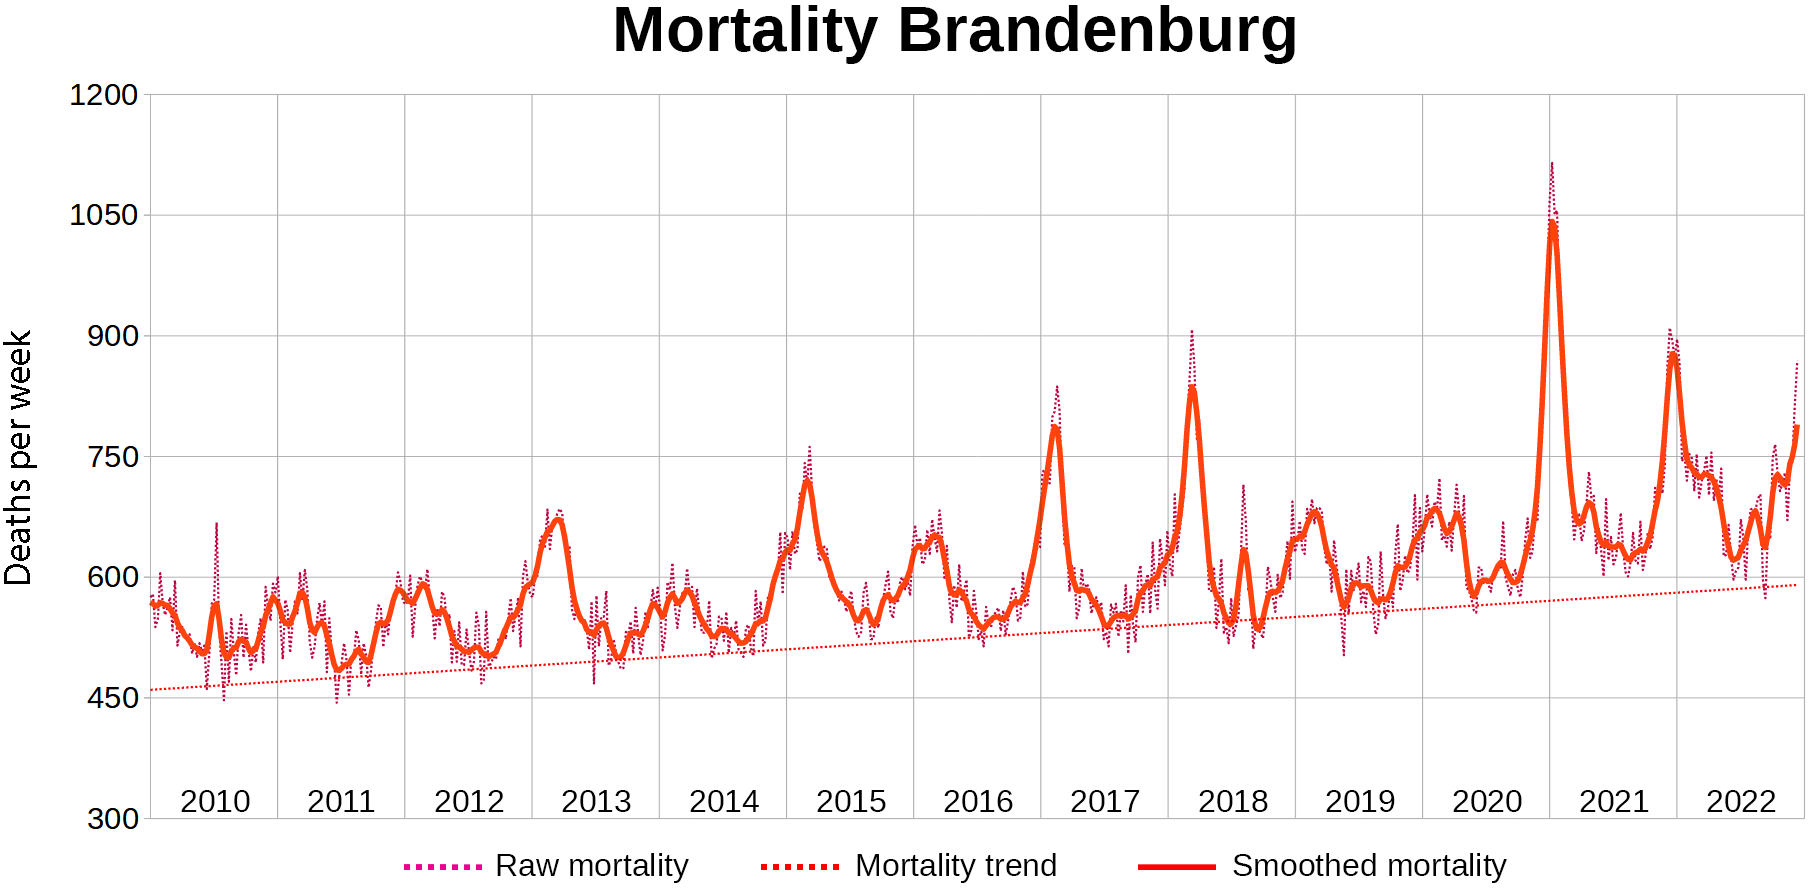
2010-2022 Brandenburg


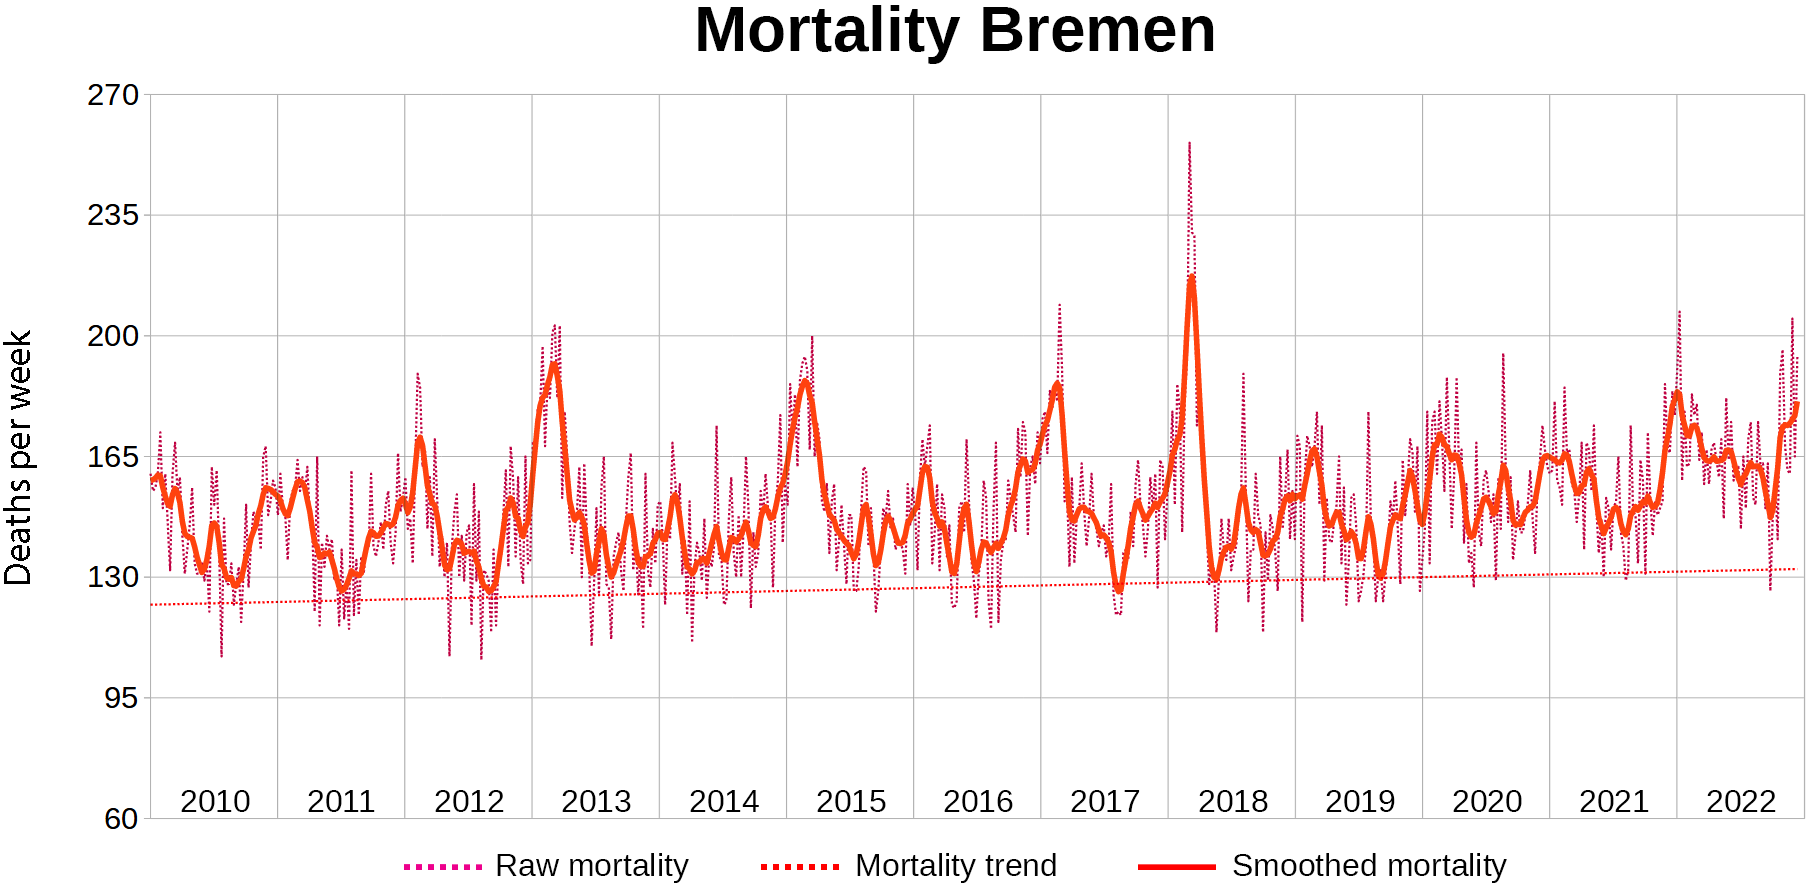
2010-2022 Bremen


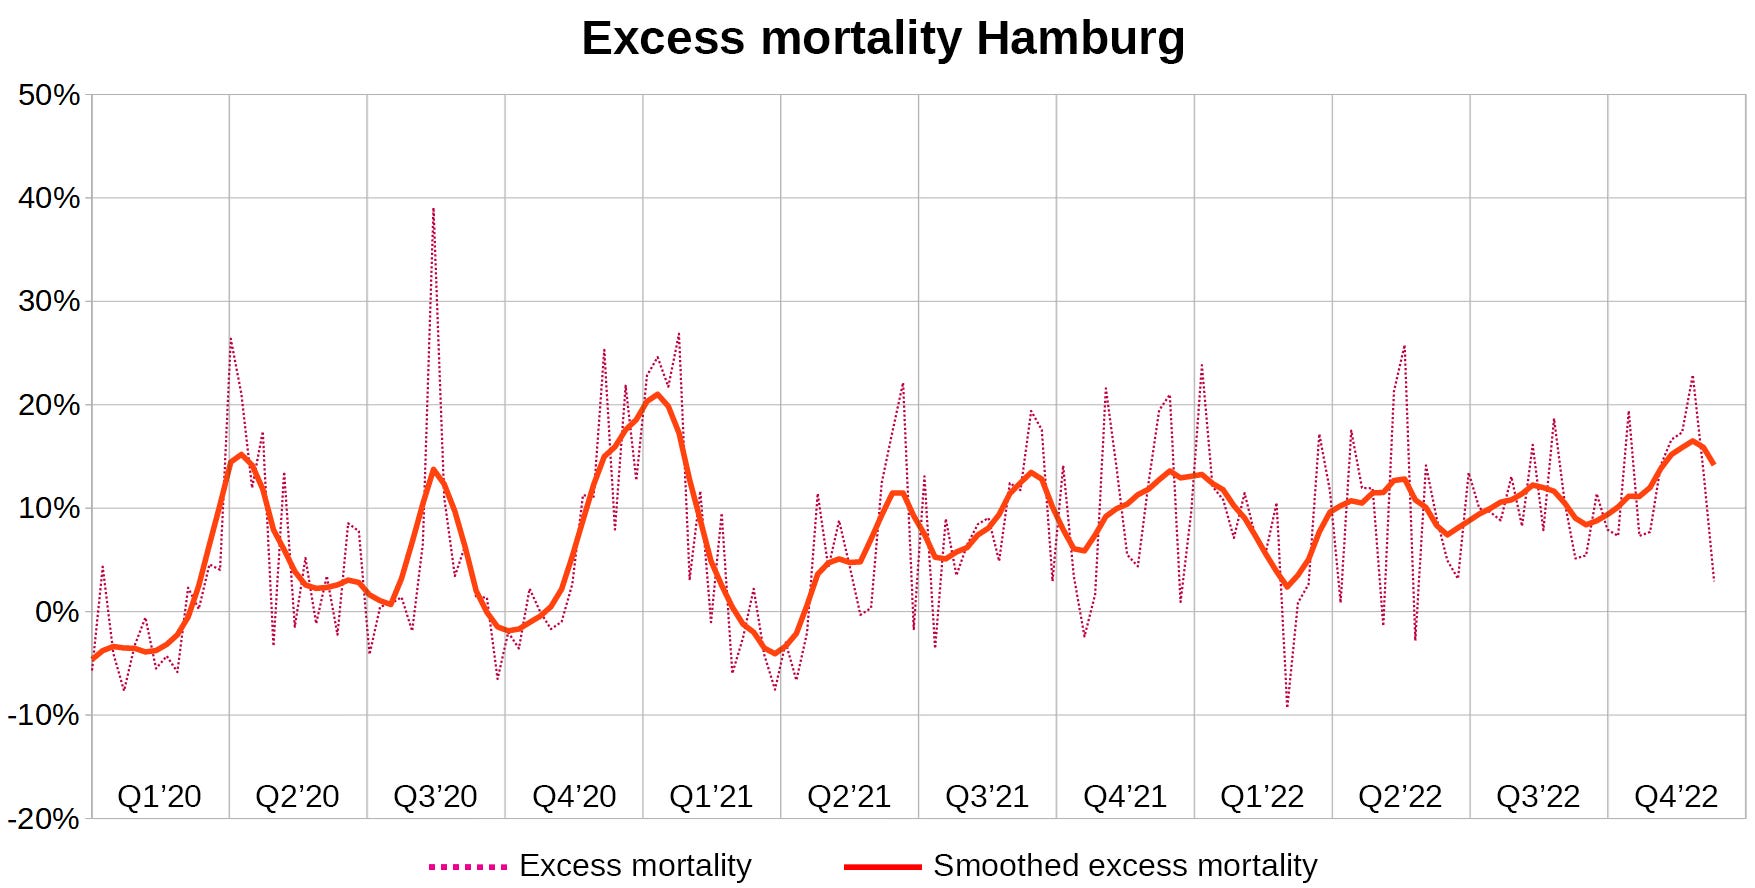
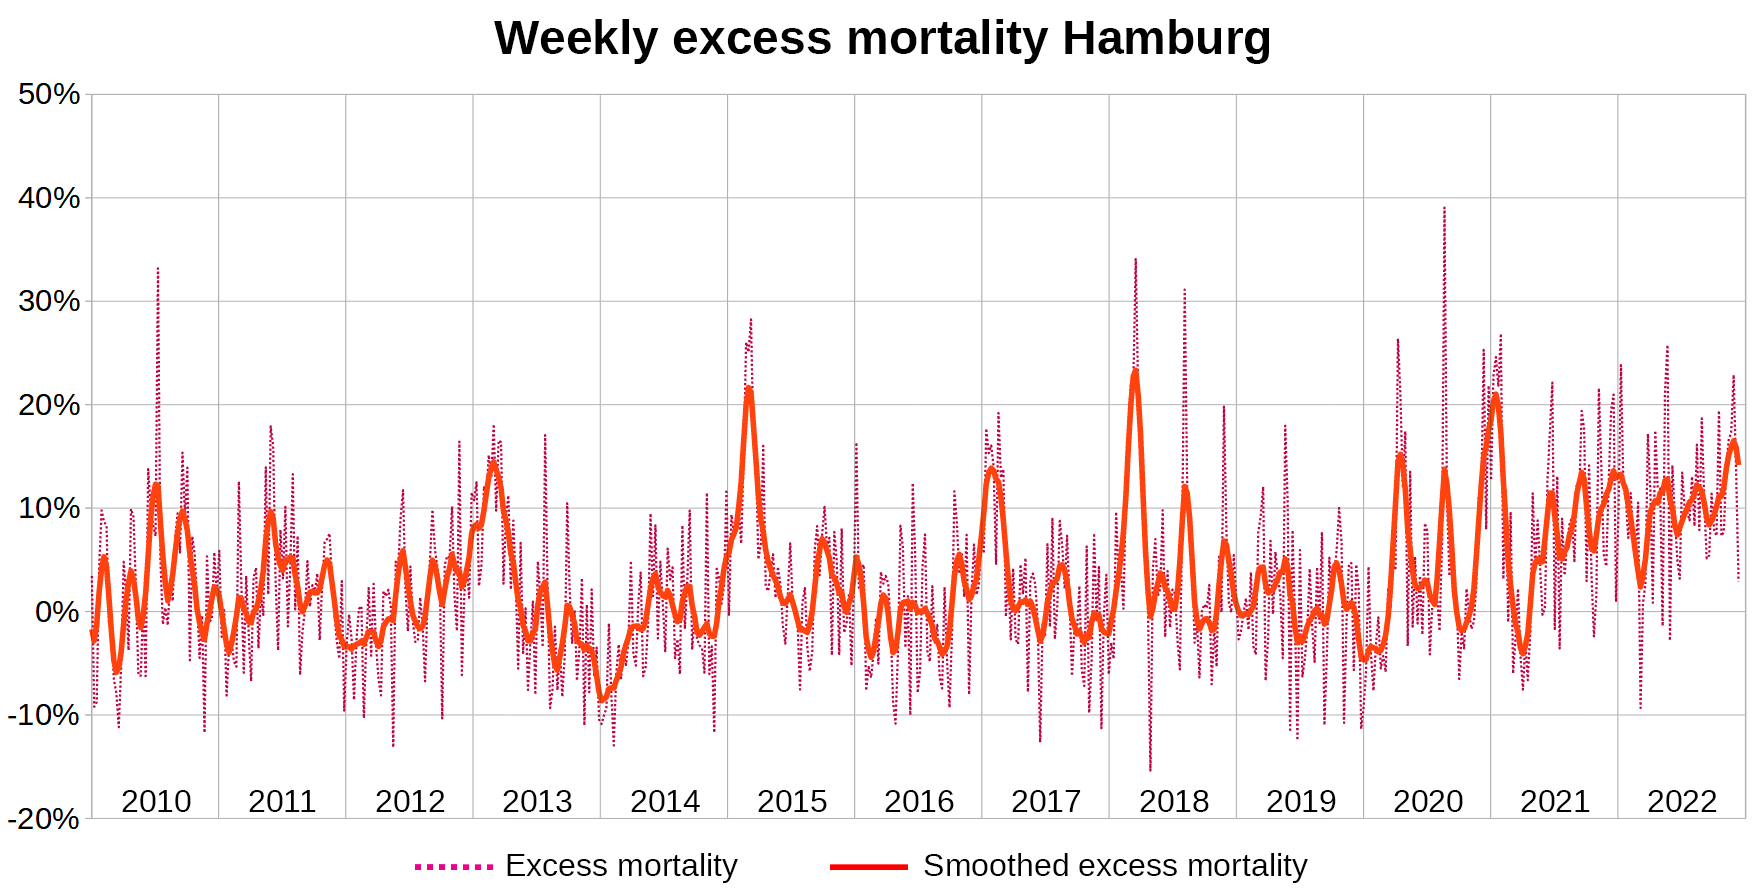
2010-2022 Hamburg


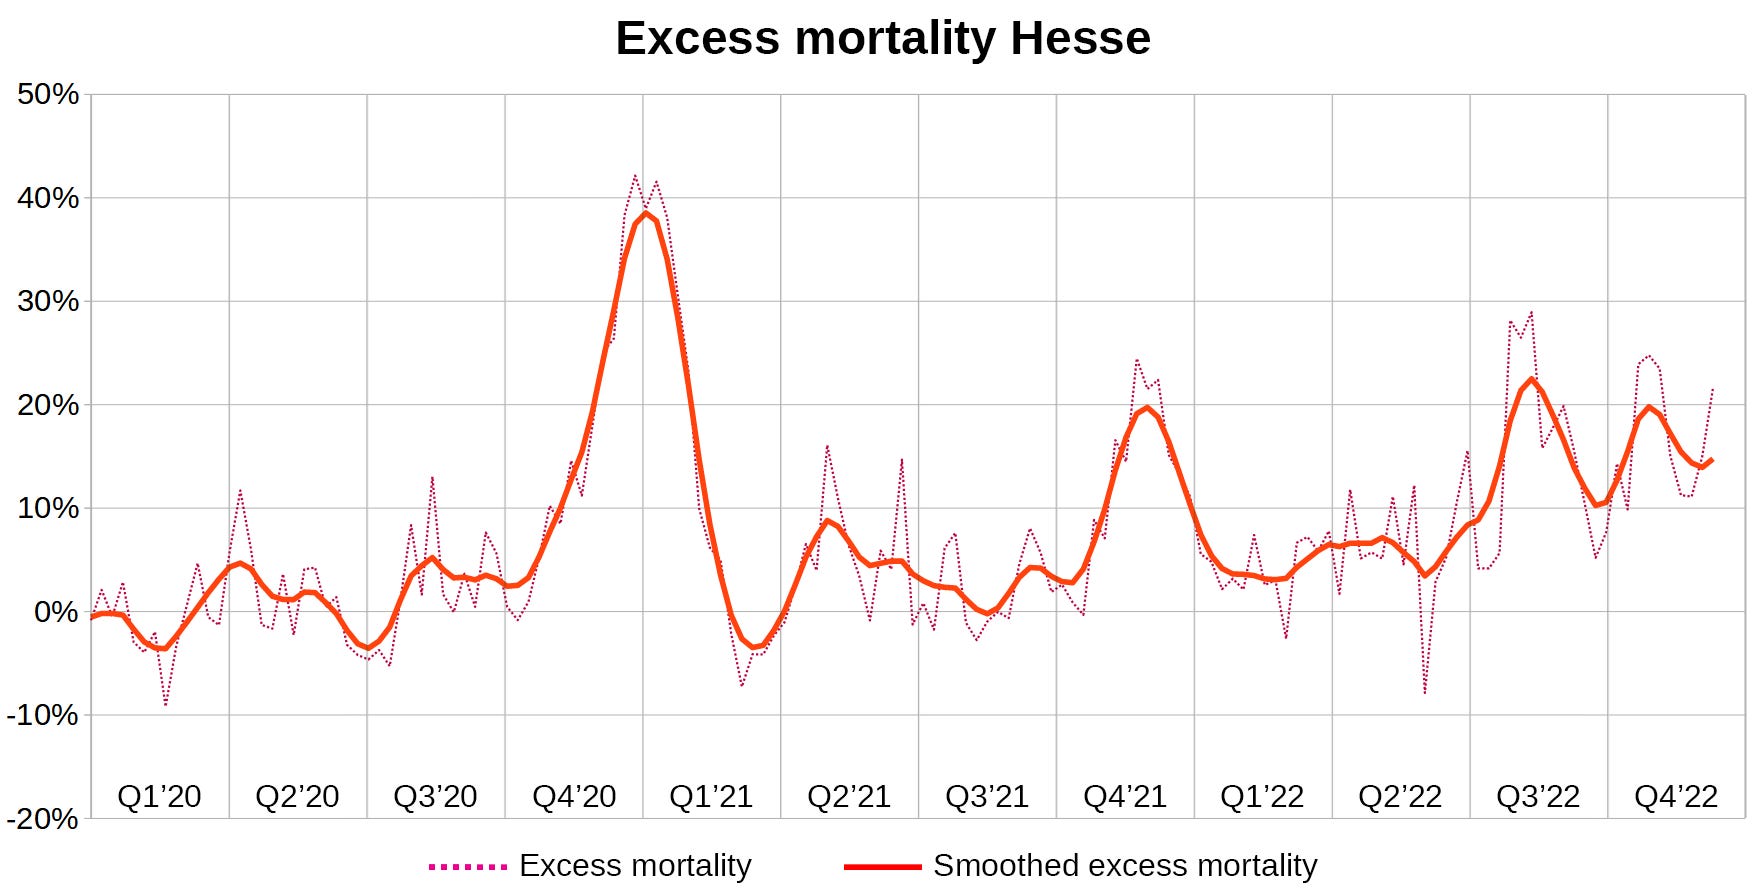
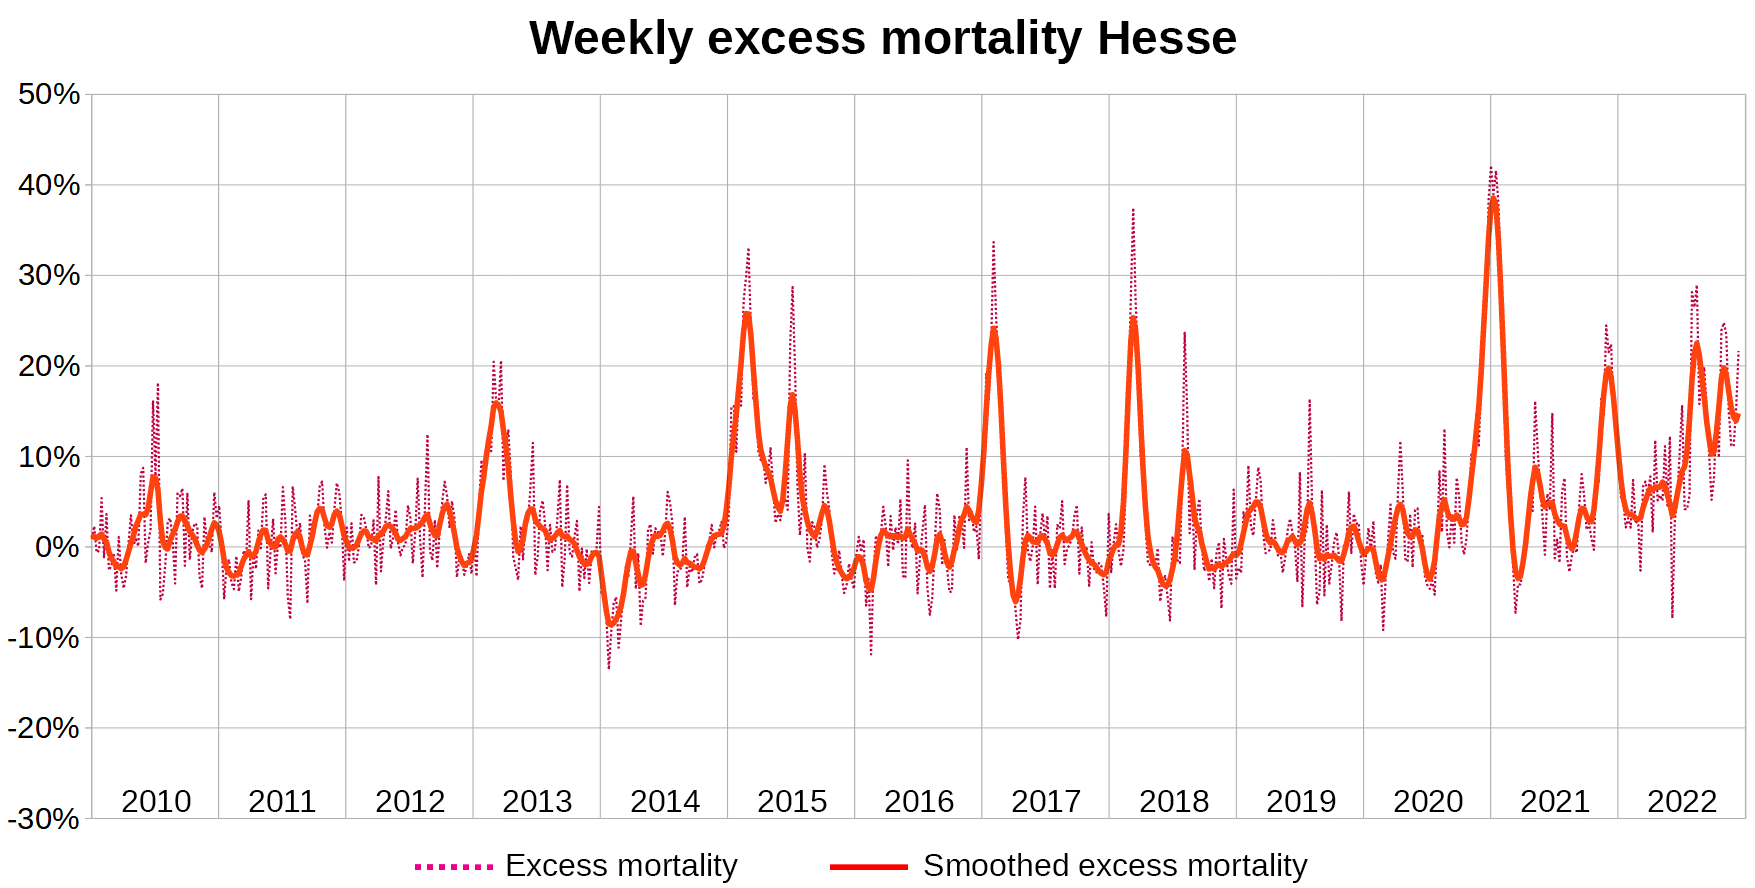
2010-2022 Hesse


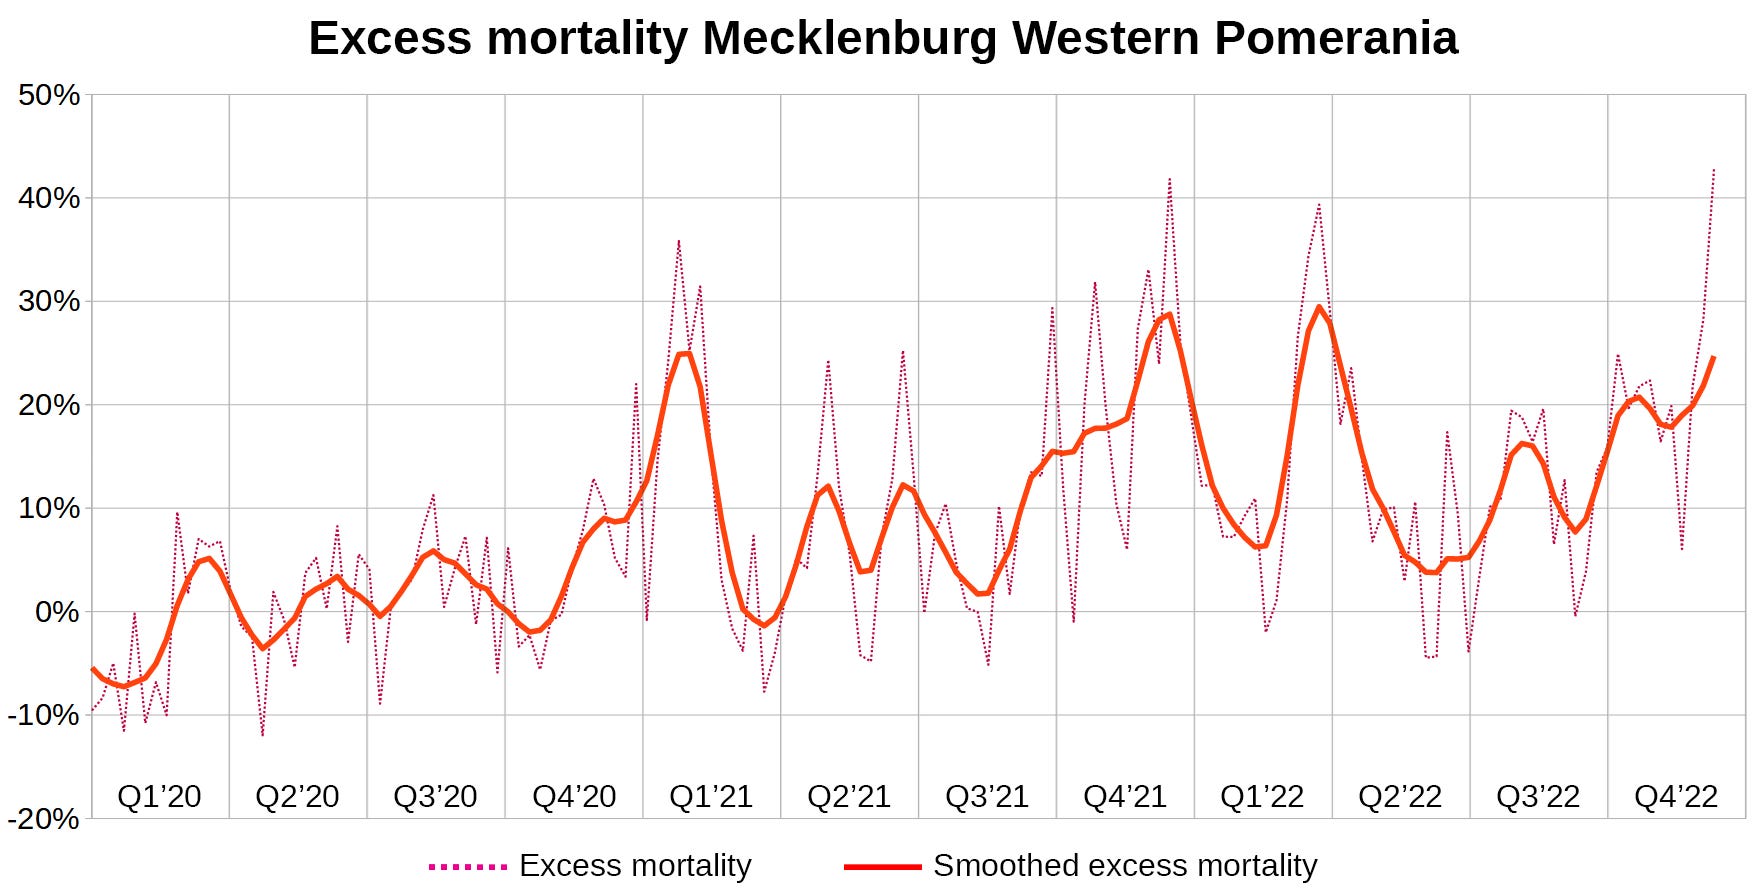
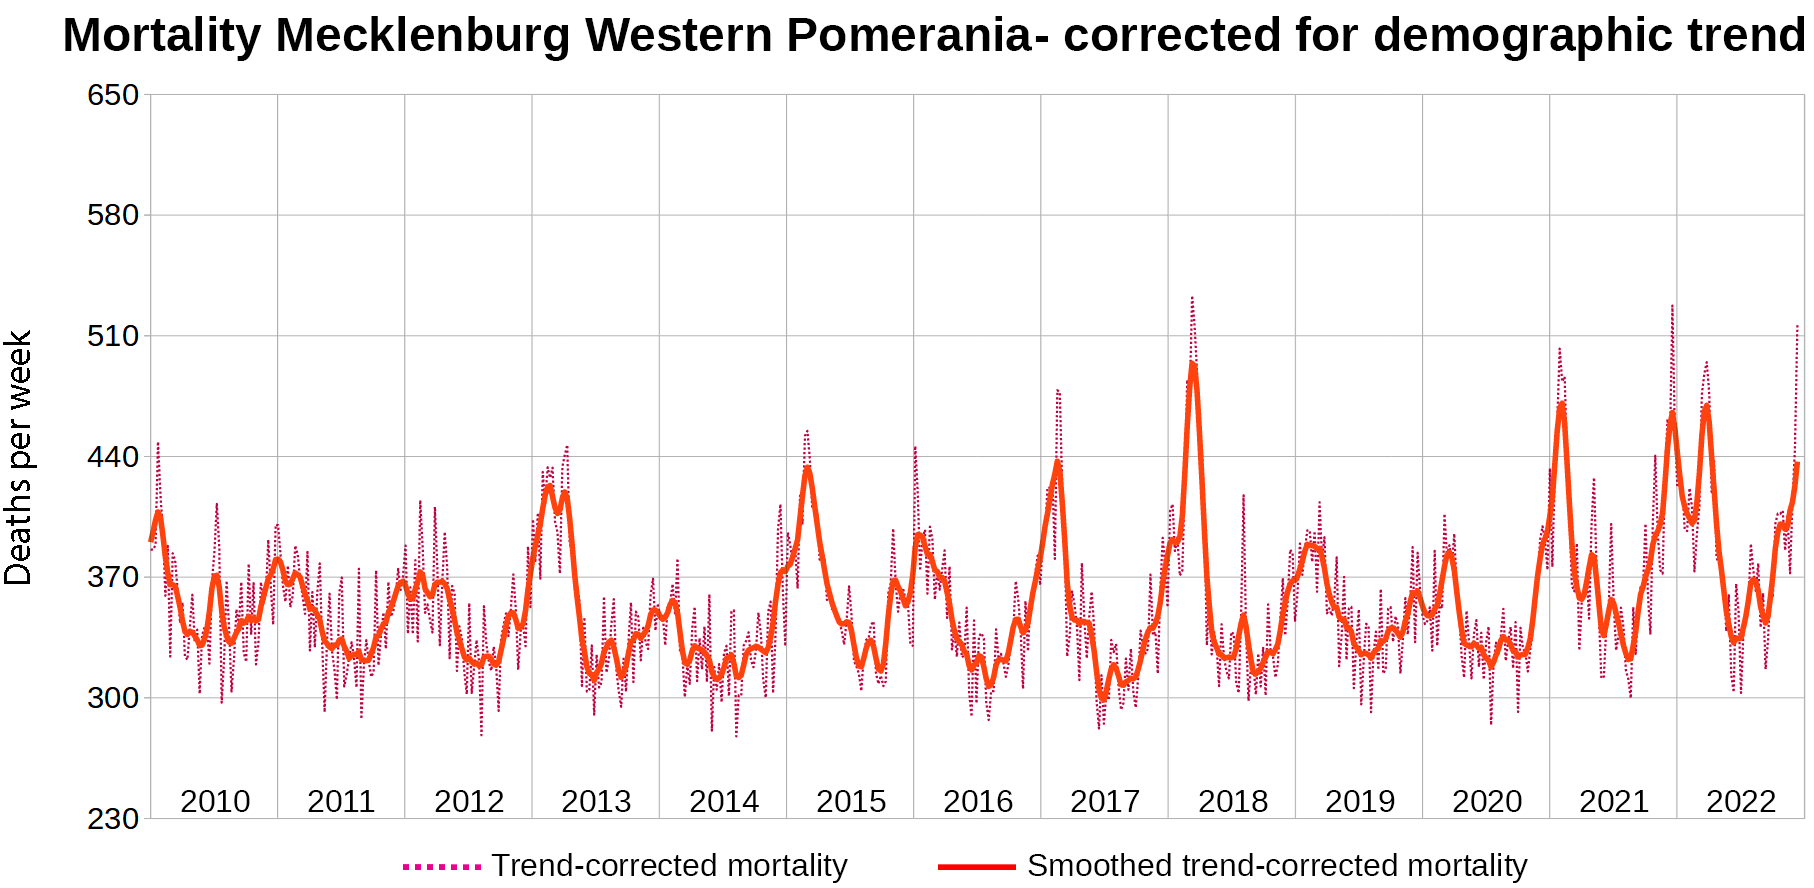
2010-2022 Mecklenburg Western Pomerania


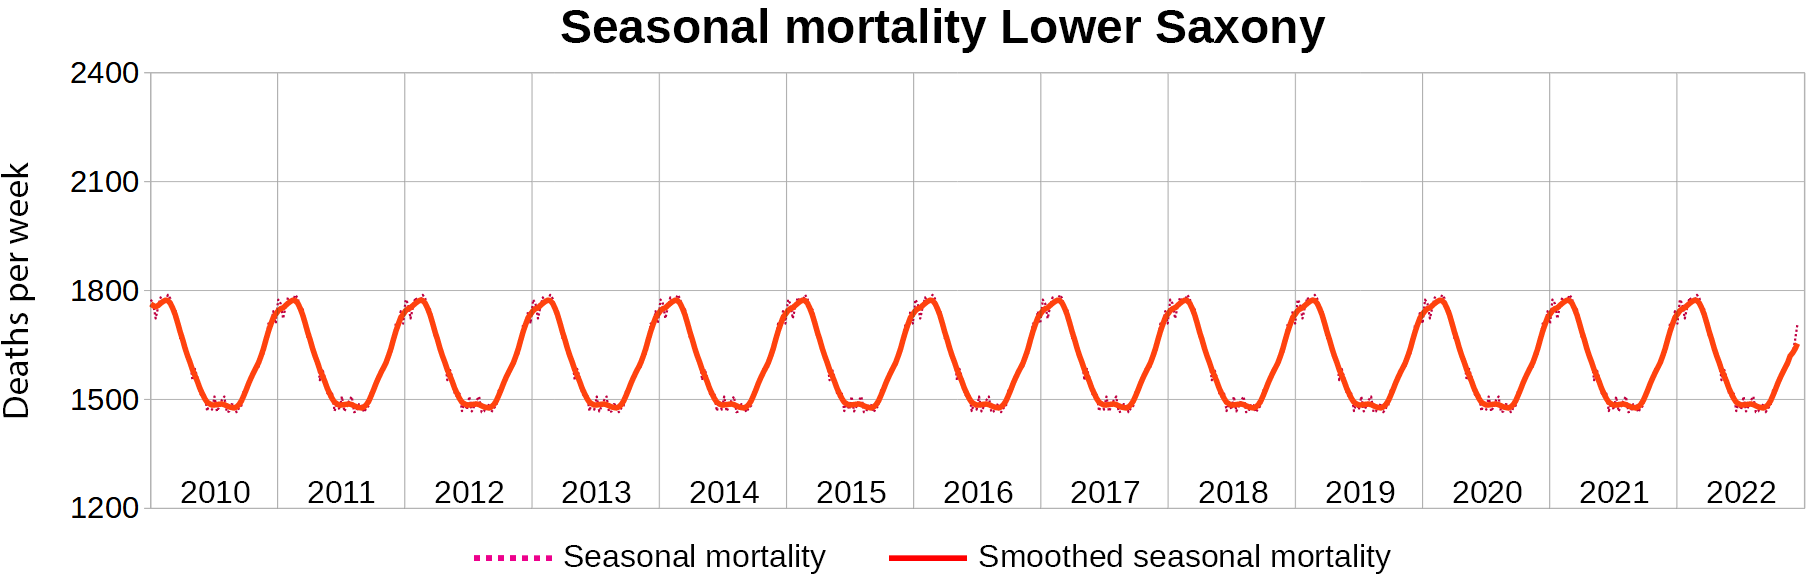
2010-2022 Lower Saxony


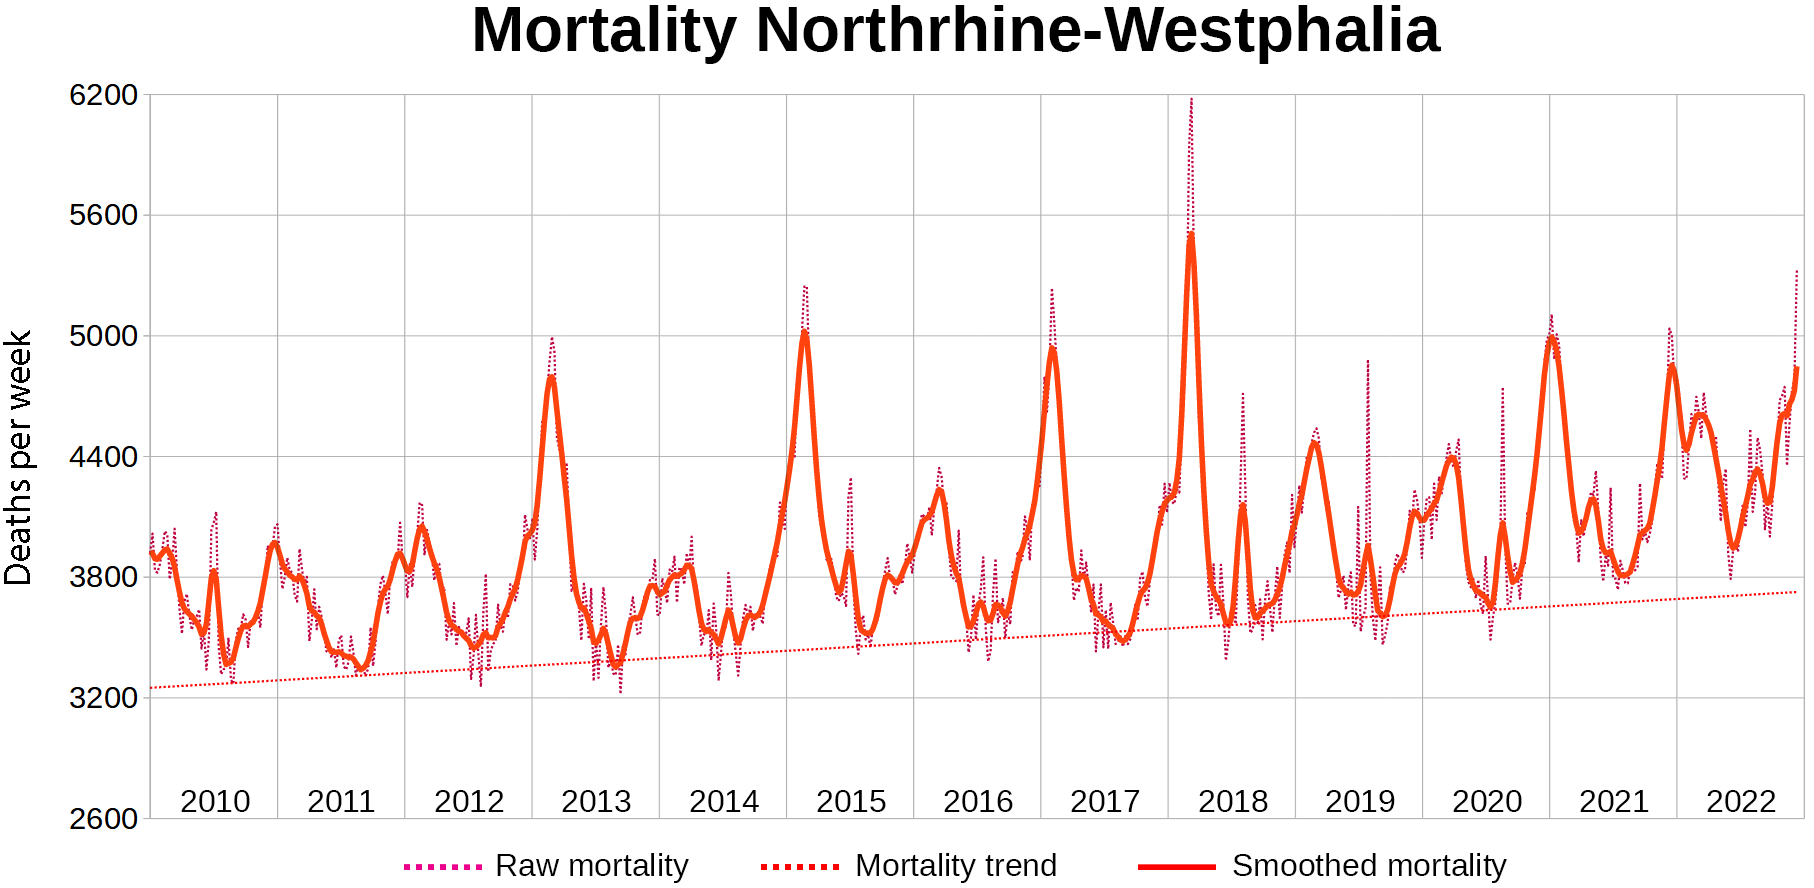
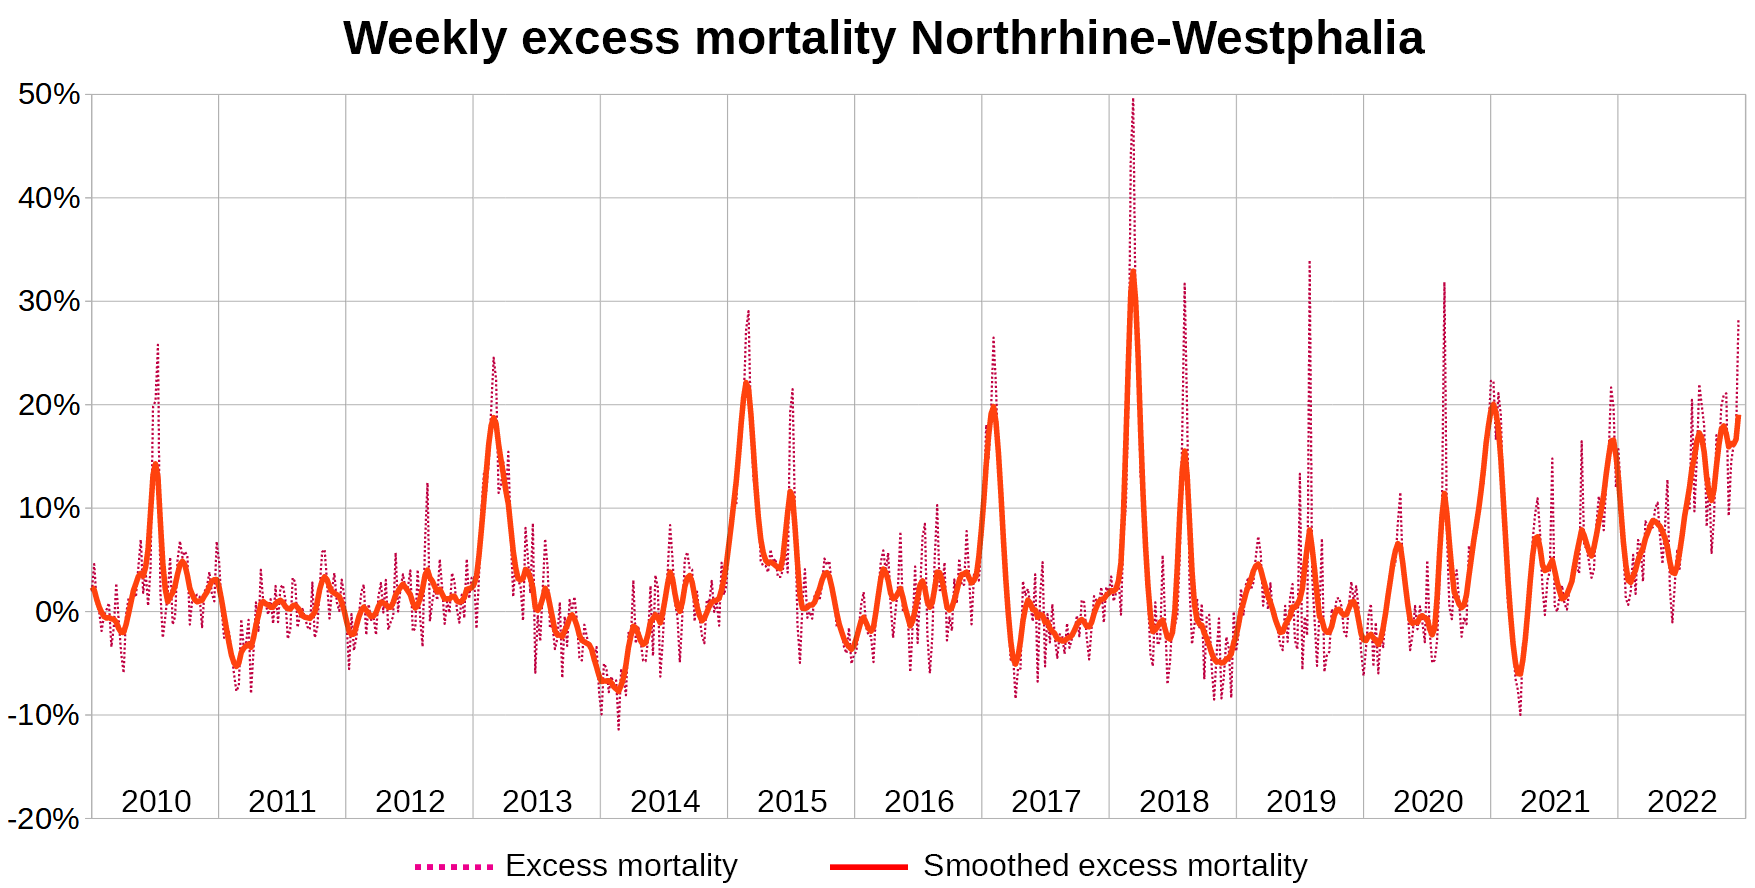
2010-2022 Northrhine-Westphalia


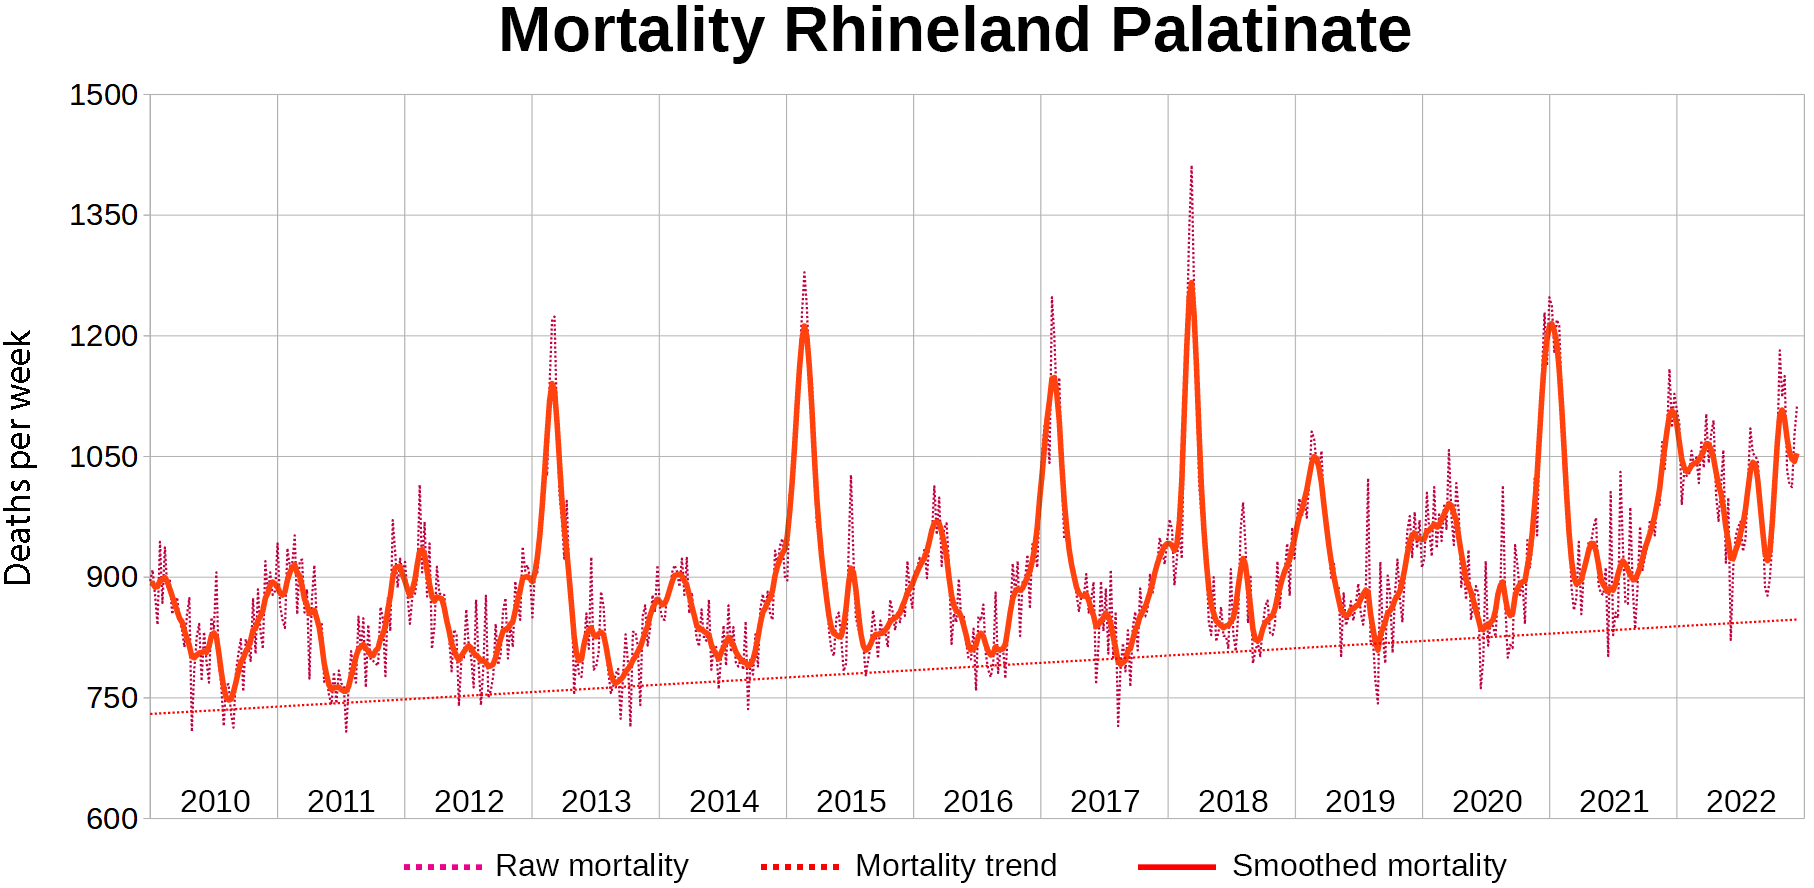
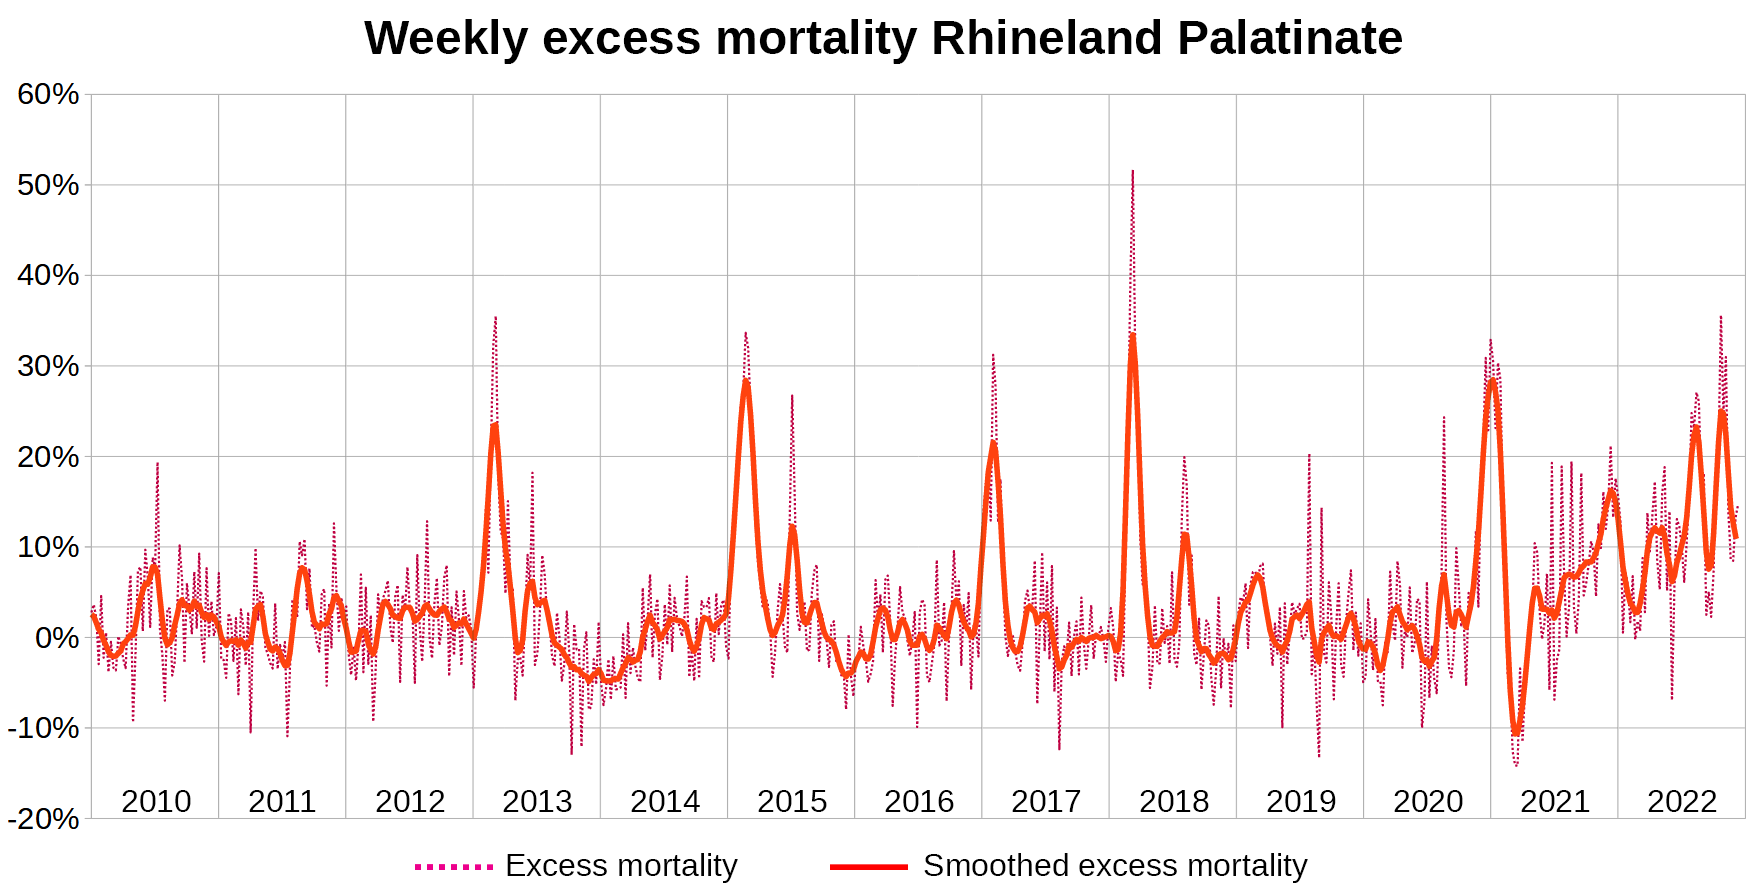
2010-2022 Rhineland Palatinate


2010-2022 Saarland


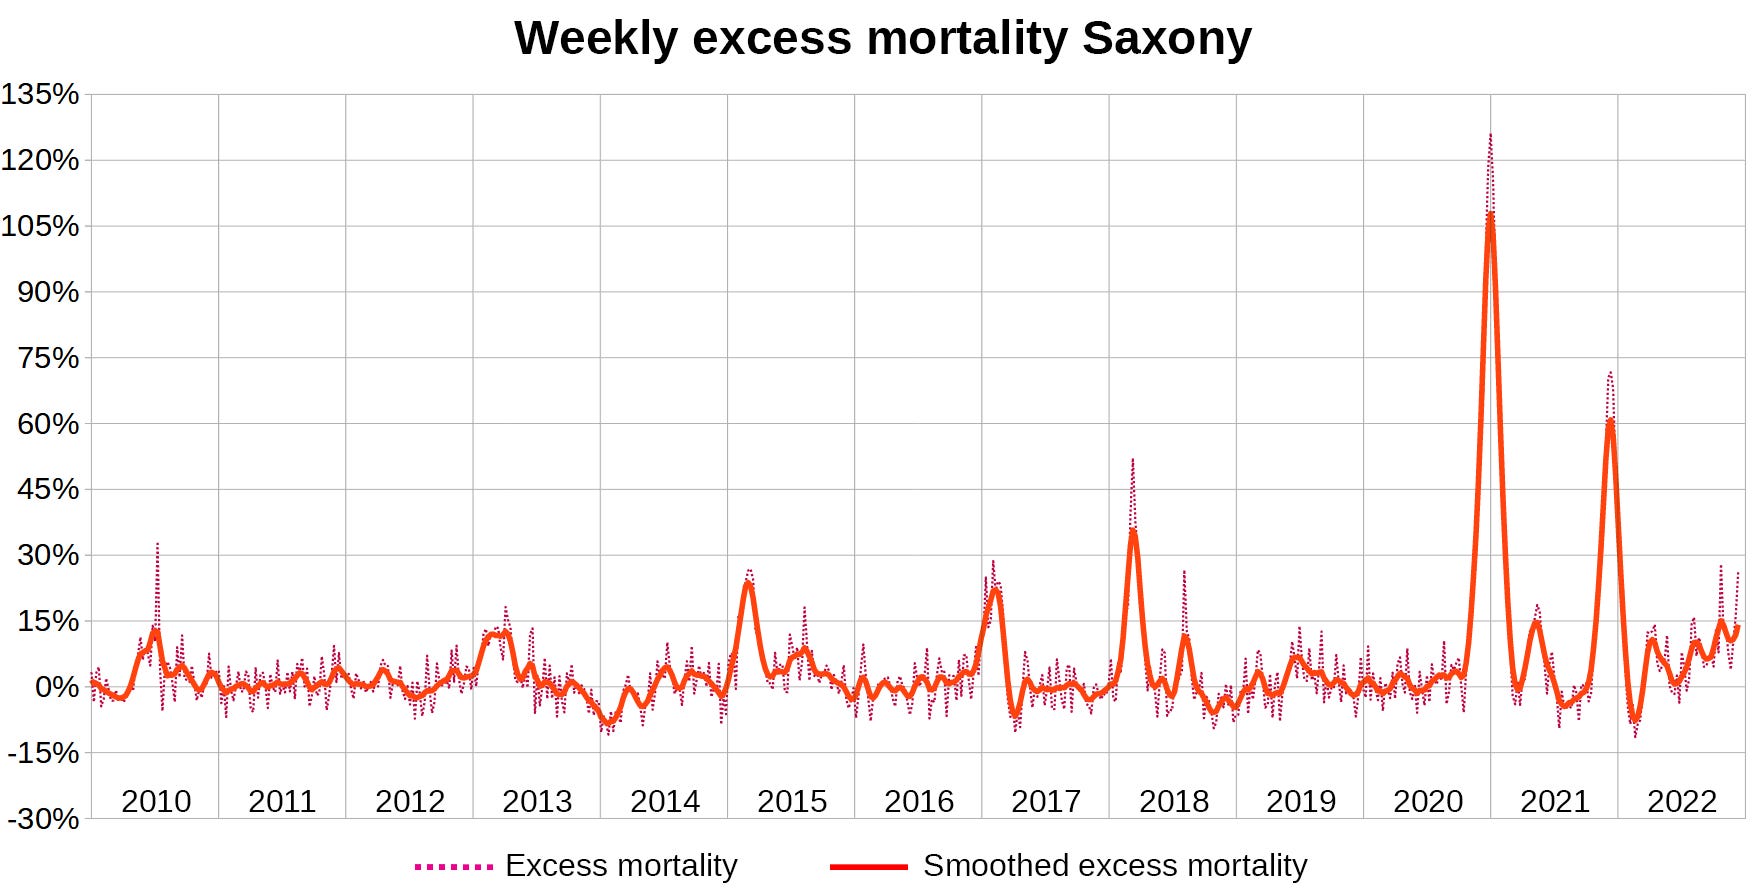
2010-2022 Saxony


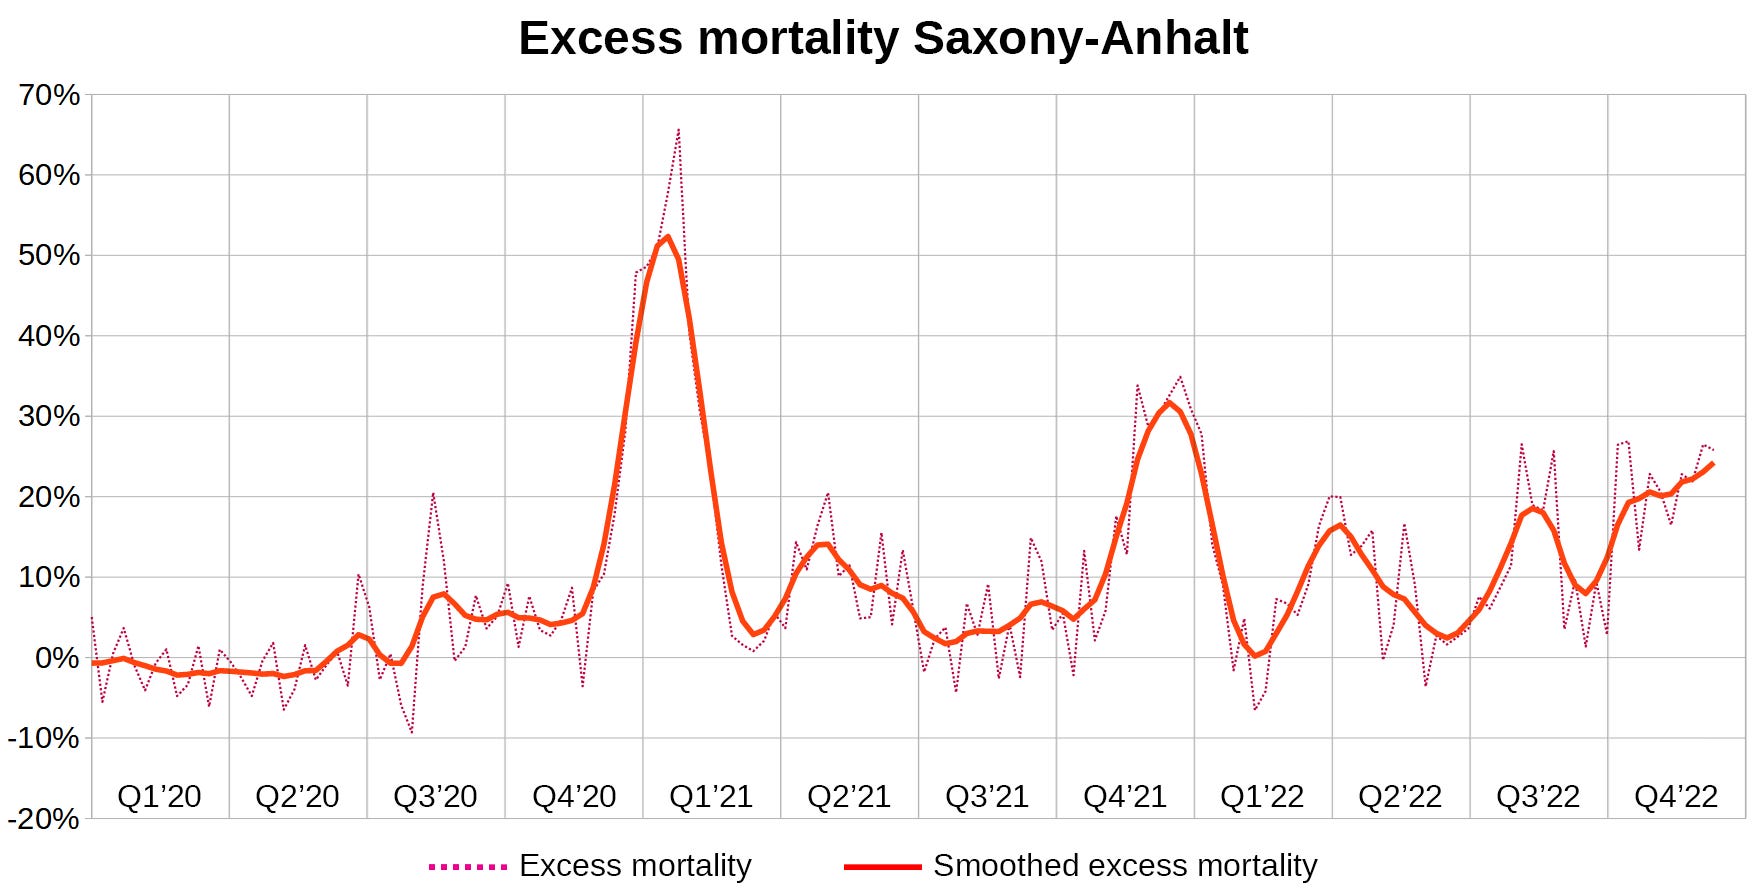
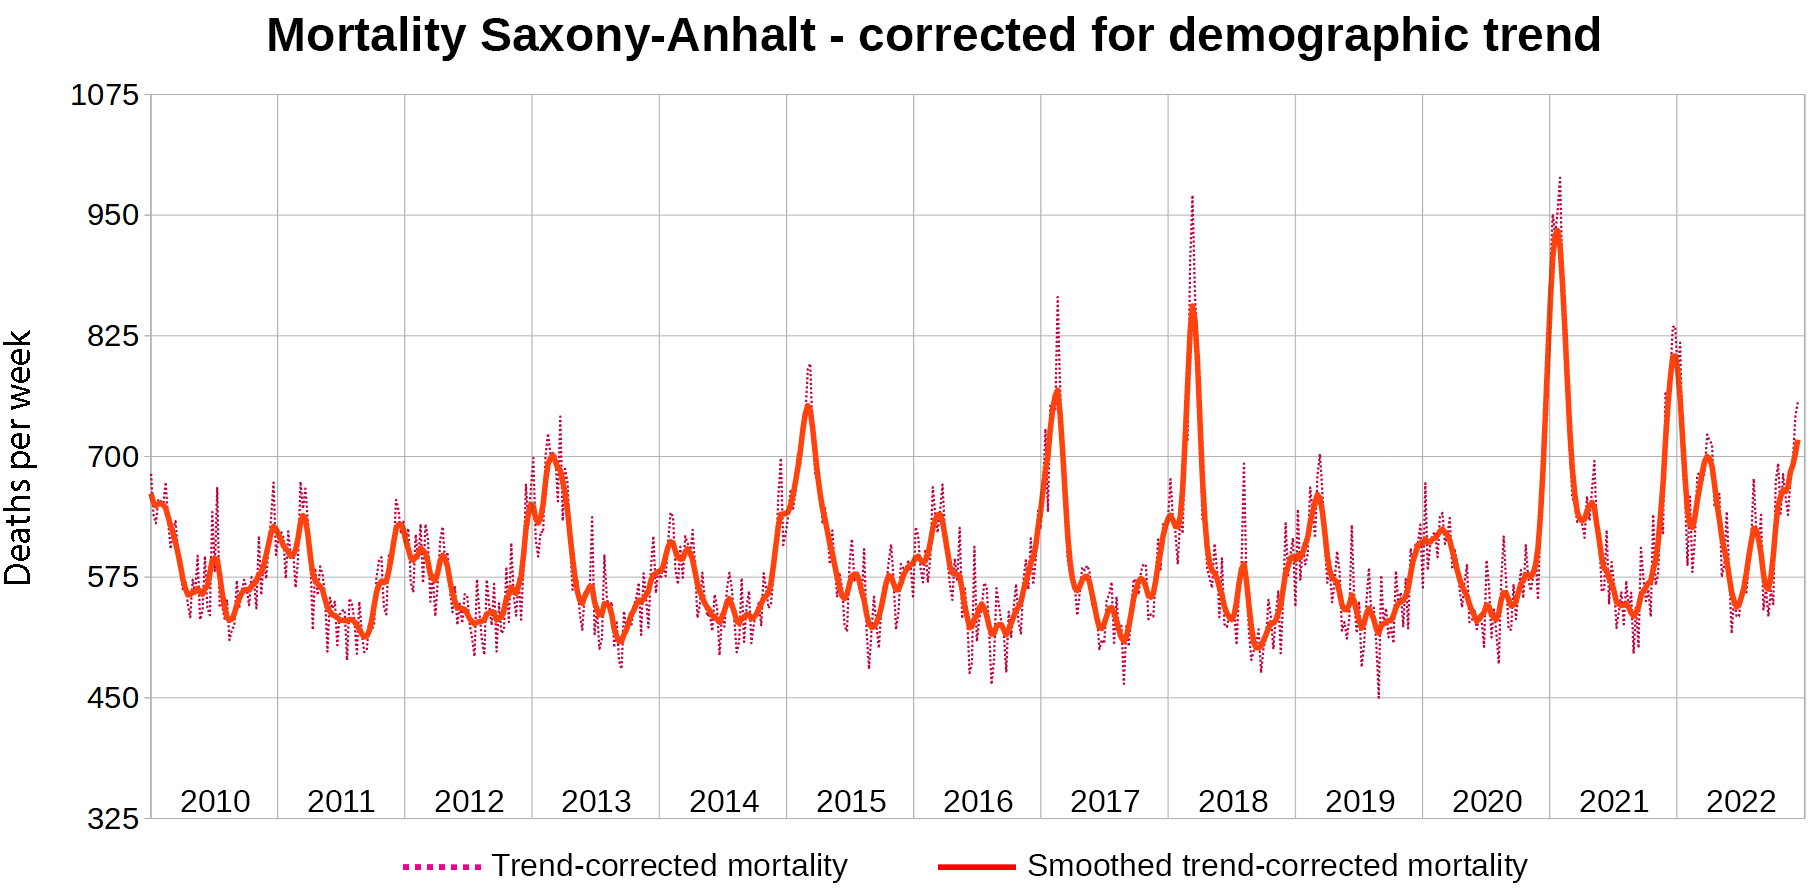
2010-2022 Saxony-Anhalt


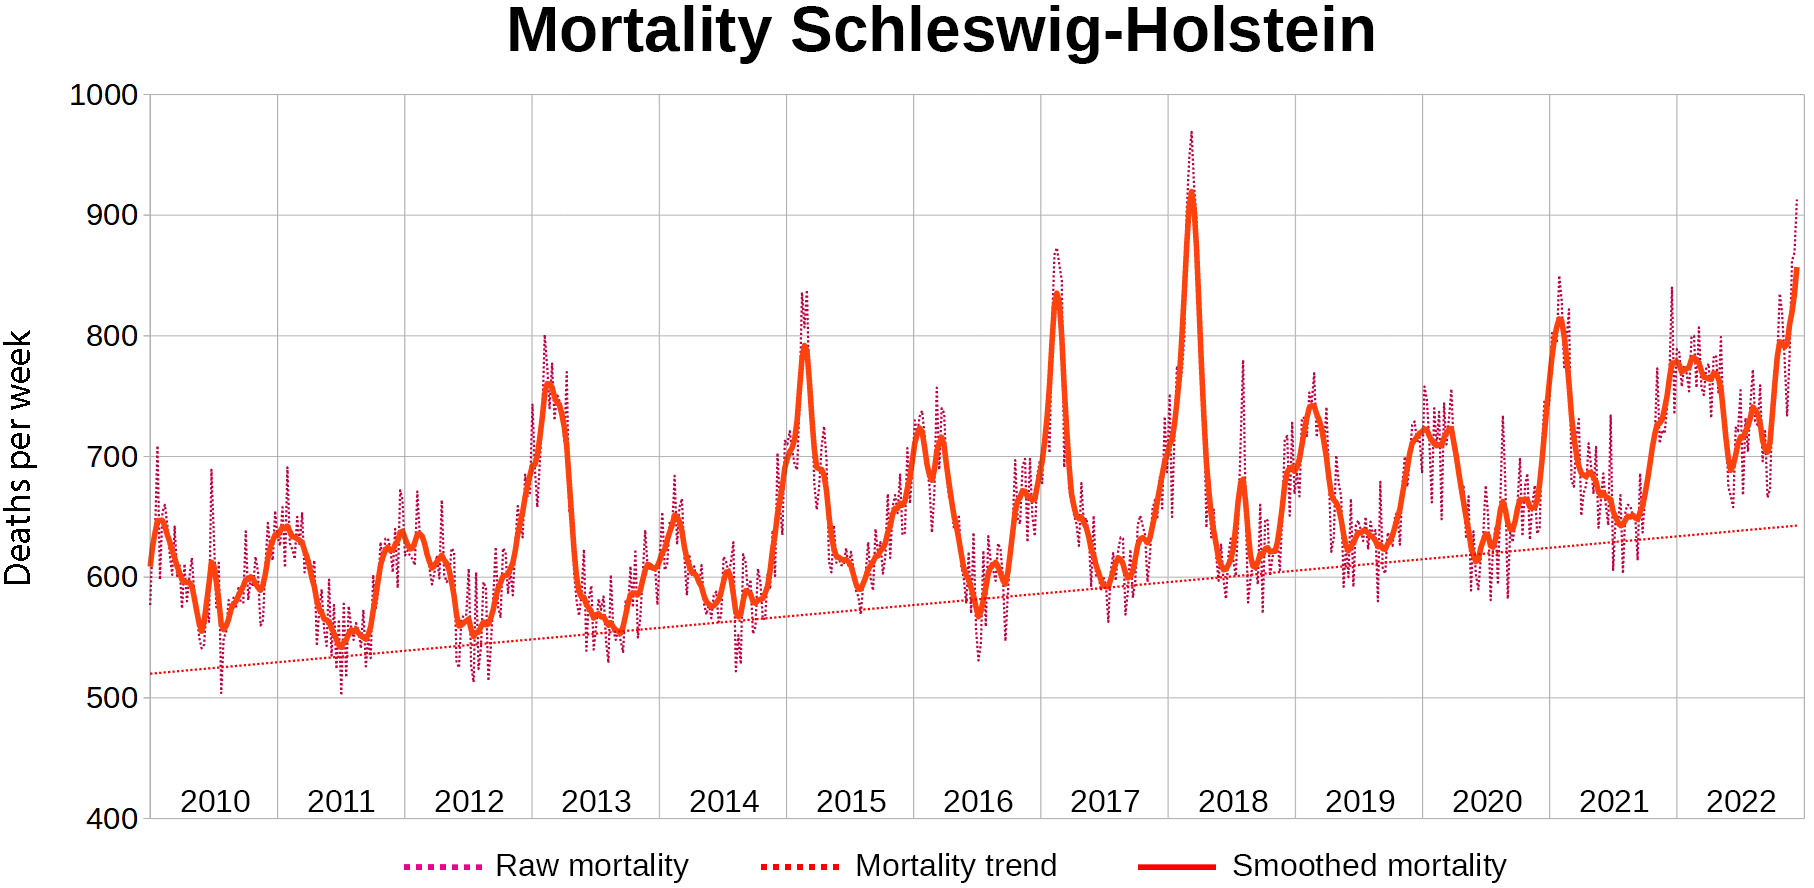
2010-2022 Schleswig-Holstein


2010-2022 Thuringia


Notes
If you are unhappy with the visual style of the charts, please let me know by commenting on this article.
Great work, Fabian! Glad I am not the only one noticing this disturbing trend.
In your "What's next section?" you did not list Covid, do you really not think this is a factor?
Looking forward to the sequels. Charts are visually very good. Methodology is robust and well-explained. Thank you. Stellar work.