
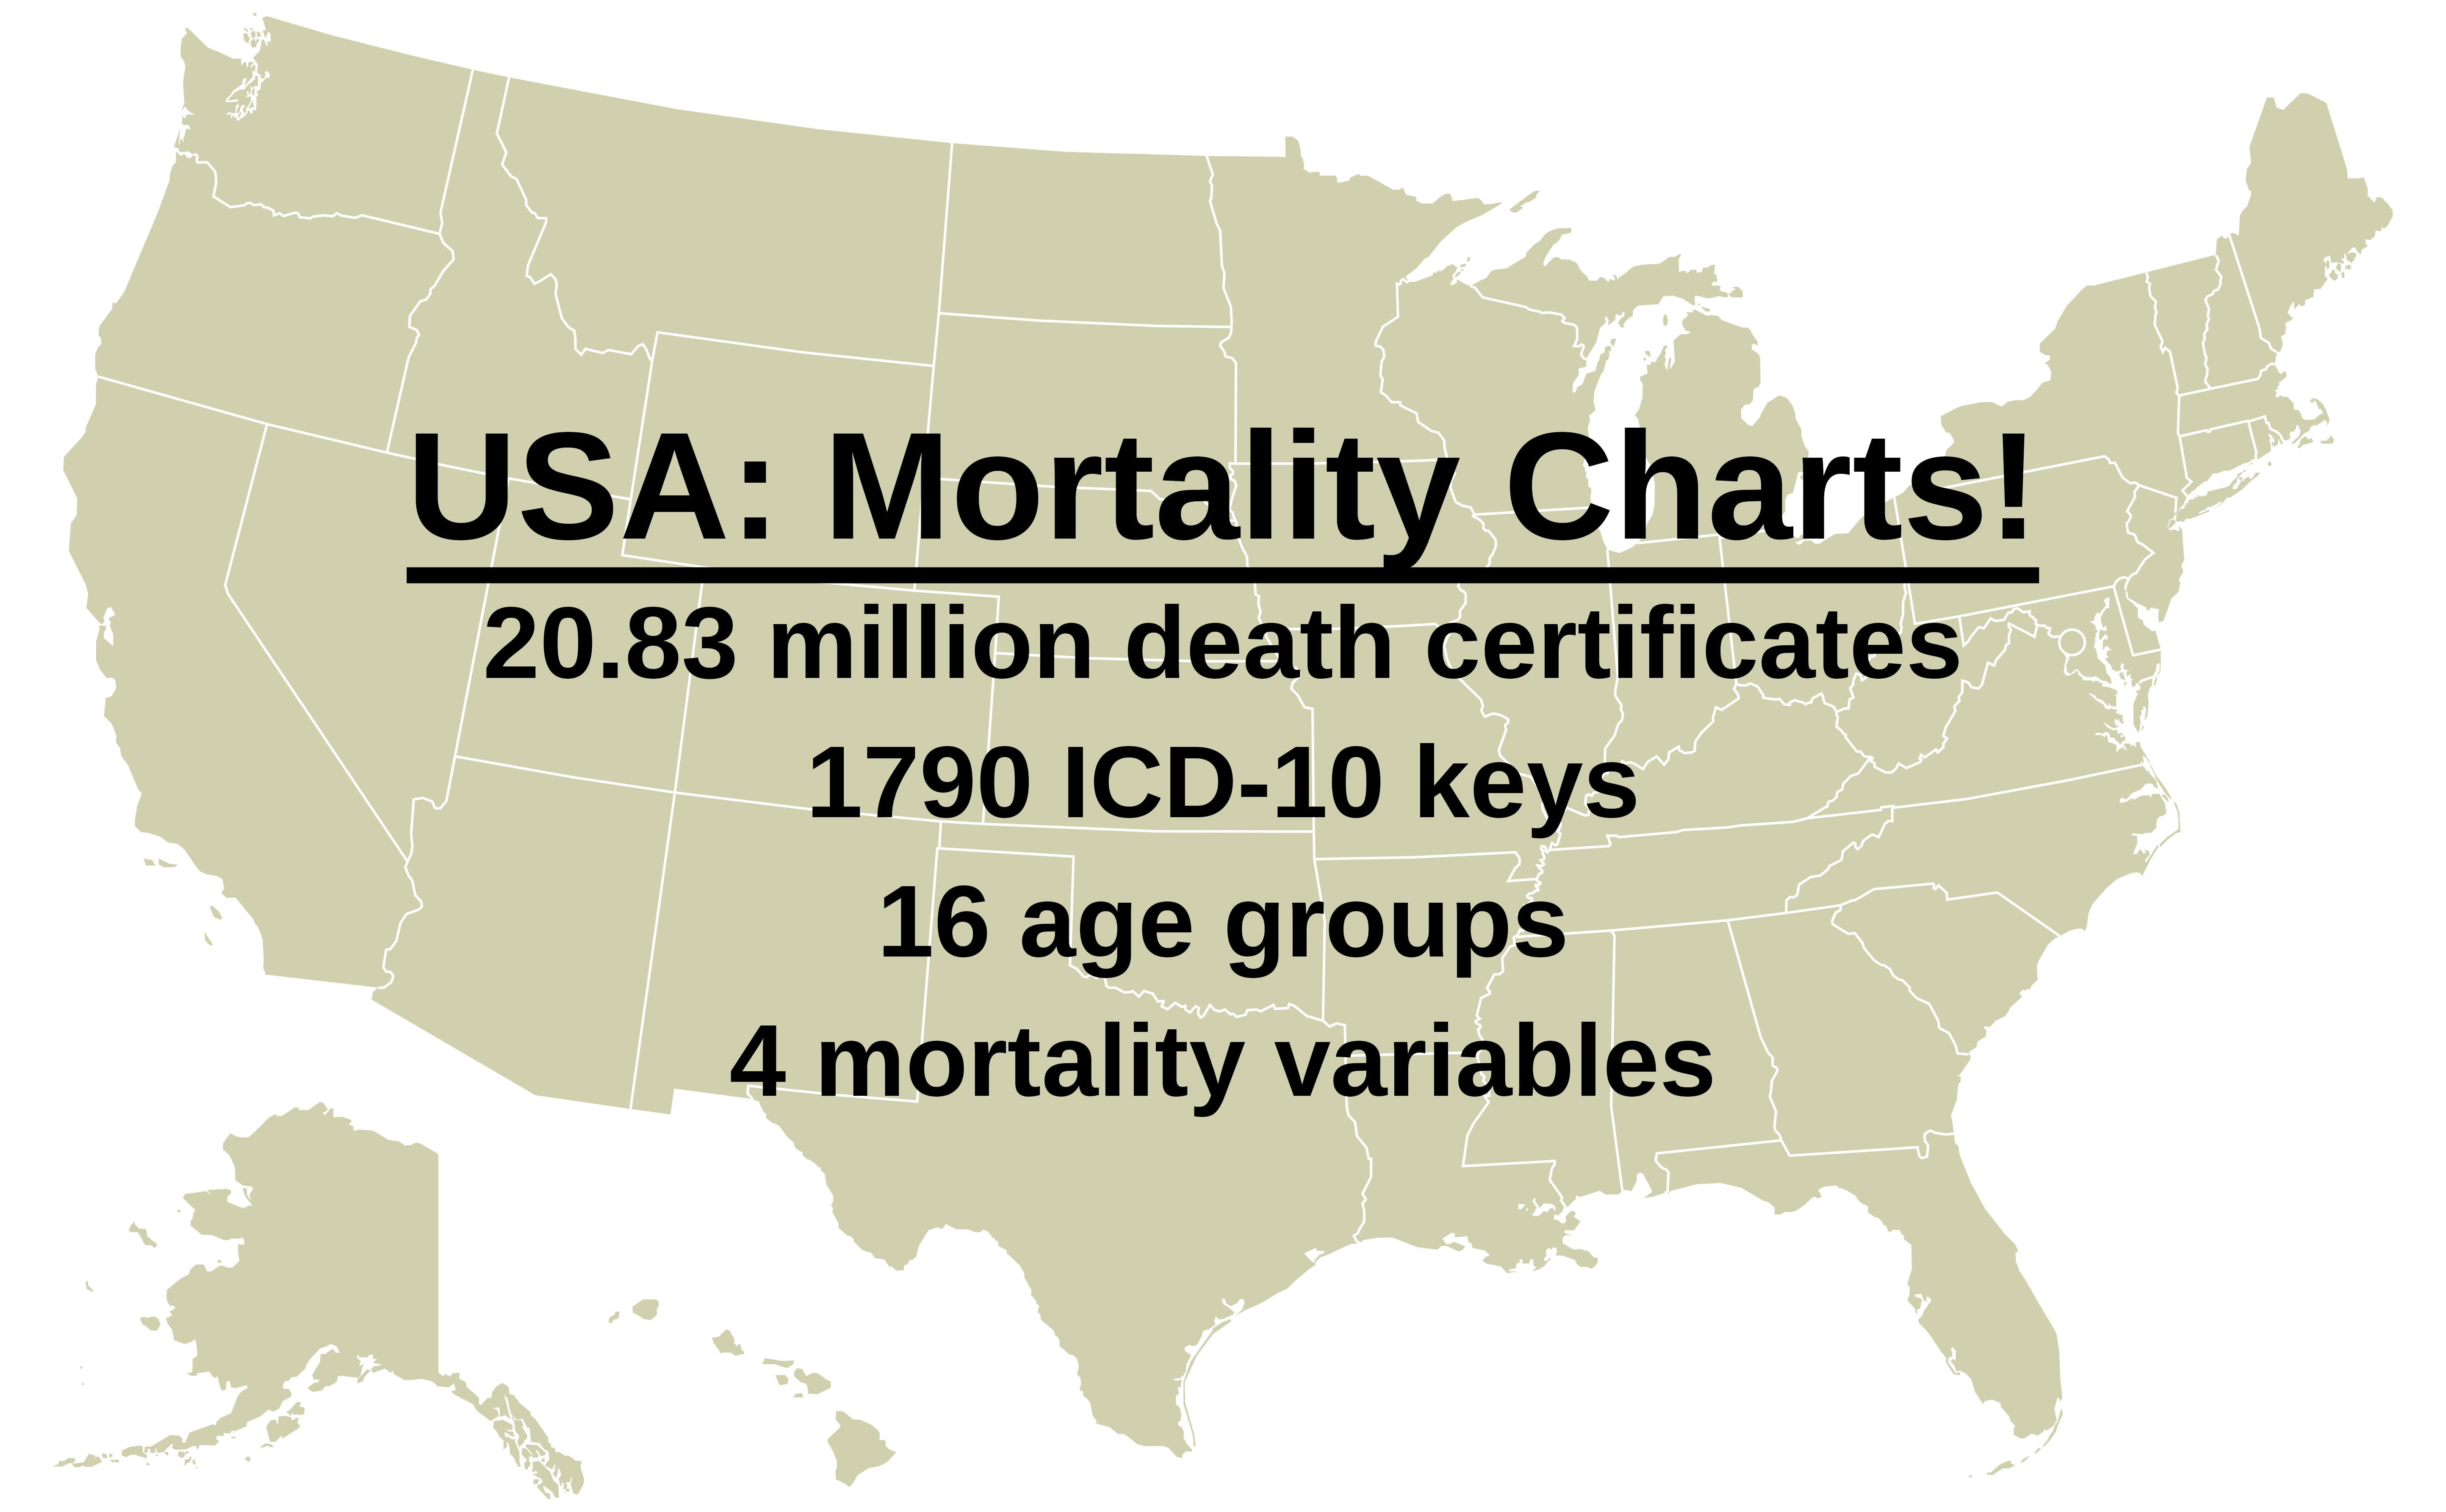
USA: Excess mortality for 1790 ICD-10 keys
Age-stratified, based on death certificates and monthly population estimates

Introduction
In order to gain a better understanding of what happened in the USA, I created a new website, which offers a total of 39,452 mortality charts based on
20.83 million death certificates
1790 ICD-10 keys
16 age groups
4 mortality variables
Content
Methods: Information on how the data was sourced and processed
Instructions: A usage guide for the website
Charts: A selection of charts that stood out in some way will be presented in another article.
Methods
Data sources
CDC Mortality Multiple Cause-of-Death Public Use death certificate files 2015-2021, excluding territories files
Census Bureau Public Use Microdata Sample files 2015-2021
Data processing
I derive national monthly population estimates for each age group by calculating 12-month moving averages forward and backward.
The same thing is done to the Puerto Rican estimates which are then subtracted from the national estimates, since I do not include US territories files
I count the number of occurrences of each ICD-10 key on death certificates for each month and age group of the years 2015-2021
The number of mentions are divided by the population estimates to yield deaths per 100k
For each month of the year I calculate the average number of occurrences per 100k in the years 2015-2019
The number of occurrences per 100k of each diagnostic key in each age group and month is divided by the 2015-2019 averages to yield excess mortality
For excess deaths per 100k I simply substract the average number of occurrences per 100k in the years 2015-2019 from the number of occurrences per 100k
We end up with 4 variables to be displayed for each age group and diagnostic key:
total deaths
deaths per 100k (based on monthly population estimates)
excess mortality (based on monthly population estimates)
total number of excess deaths per month (based on monthly population estimates)
I am mainly interested in 2020 and 2021. While what I did here may be a quick and dirty approach to the problem, I still wanted to see what happened in 2019, so the period displayed on the charts begins with January 2019.
Inclusion criteria
To be included, any given combination of ICD-10 diagnostic key and age group needs at least 1 mention every month from January 2015 through December 2021.
There are a total of
1790 ICD-10 keys
16 age groups (85+, 75-84, 65-74, 55-64, 45-54, 35-44, 25-34, 20-24, 15-19, 10-14, 5-9, 0-4, 0+, 65+, 0-64, 0-24)
included on the website, for a total of 4 x 9,863 = 39,452 charts.
The website
I suck at HTML, CSS and SVG, albeit not as hard as the CDC staff. Pervaers.com is the only website I’ve ever created. Since I tried to solve the problem in less than a day, I had no time to acquire the skills needed to polish the website. It does what it should, but it could surely be improved, especially when it comes to mobile devices. If you are better than I am at these things, I would appreciate your help.
Instructions
On PC
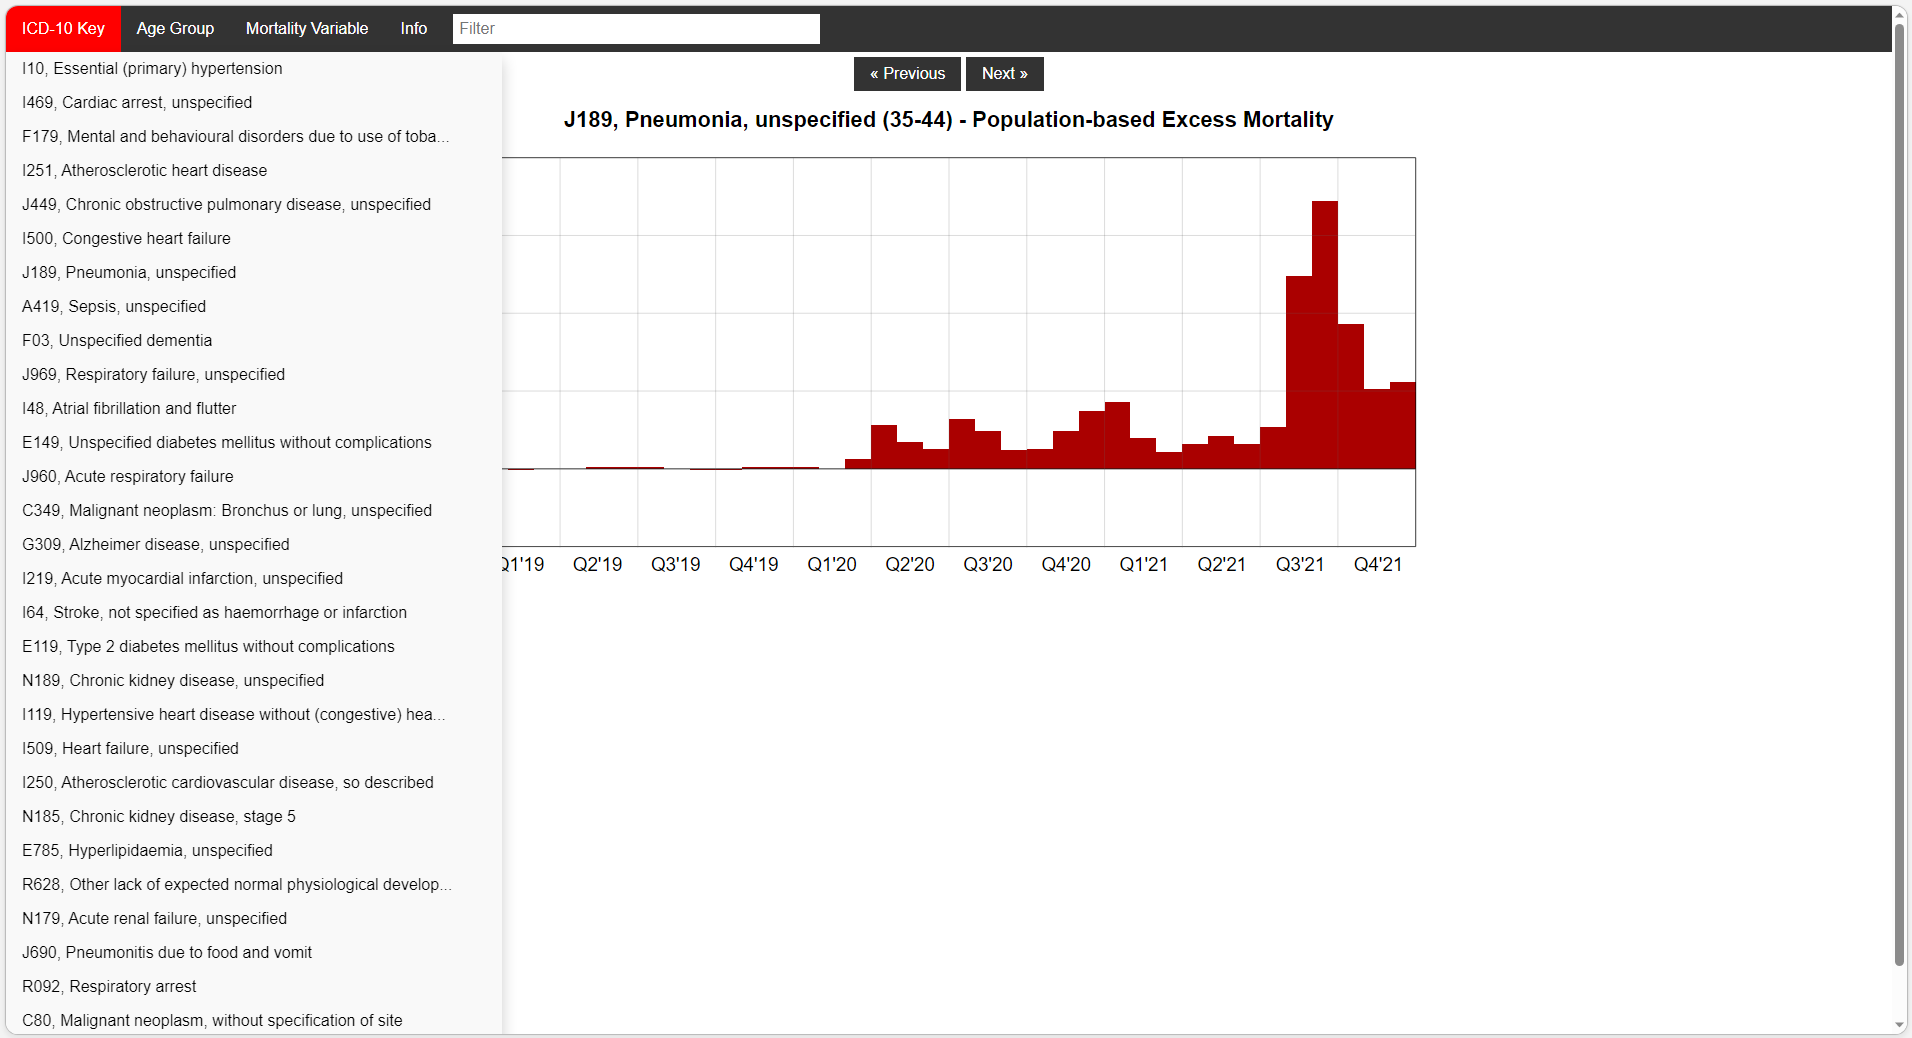
To pick a diagnostic key you can…
pick one from the ICD-10 Key navigation bar button as shown in the screenshot. The dropdown list can be scrolled by using the Mousewheel.
press the Previous/Next button above the chart
Pick an age group from the Age Group dropdown
Change the variable displayed on the charts via the Mortality Variable dropdown
Enter a filter expression into the filter input box matching either the ICD-10 key without periods or the first 50 characters of the key’s description according to the WHO. Text entered is interpreted as Regular Expressions. E.g. cardi(ac|tis)
On phones
You cannot scroll the dropdown list via Swiping when using your mobile device, because I’m really bad at CSS. This forces you to enter a filter expression when you are looking for a specific key, matching either the ICD-10 key without periods or the first 50 characters of the key’s description according to the WHO.
Entering a filter expression will both shorten the dropdown list and allow you to cycle through the list much faster when using the buttons.
Charts
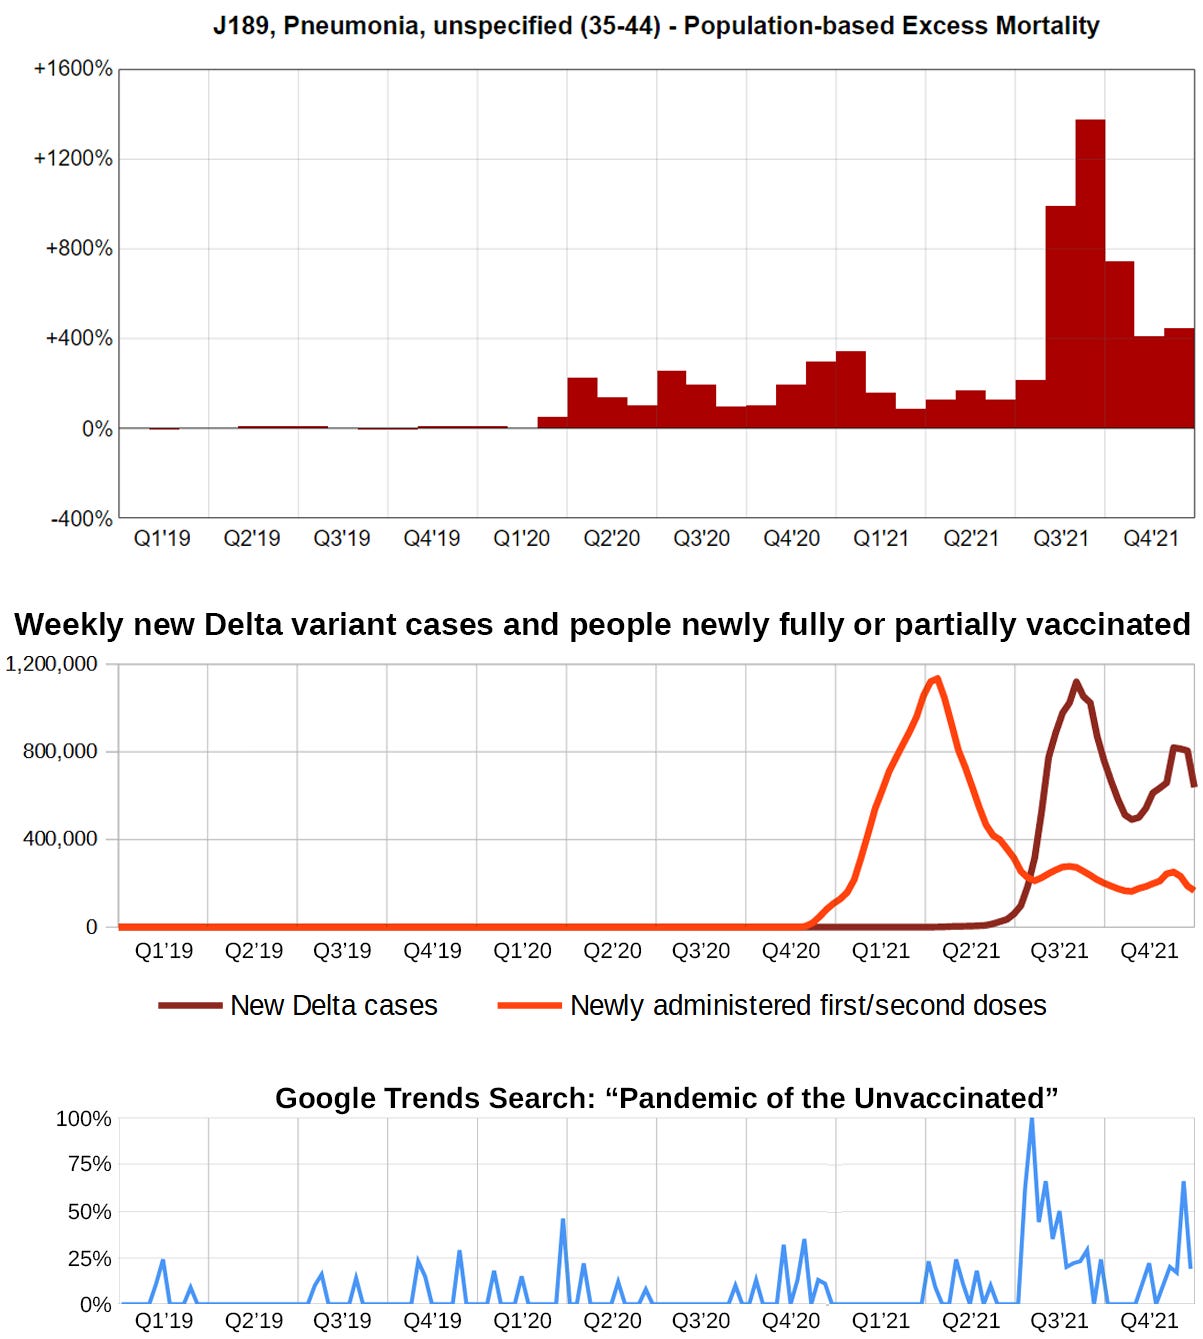
Just so you don’t have to go home empty-handed in case the website isn’t for you, here’s an image I like:
Notes
Feel free to tell me your findings in the comment section. I have yet to analyze the data myself.
If you can code HTML/CSS, I would really appreciate your help with allowing users to cycle through the ICD-10 Key dropdown menu by swiping.
You could just edit the source files and send them via email and I’d forever be your fan.
Brilliant! Sharing for Data Nerds on Gettr.
You appear to have the data for external analyses using Bayes, which is what the world is lacking. Bayesian analysis provides probabilities modulated by dependencies. I can do that and put it in a front end- it's a free analytical system. I need access to a sample of the original database. The slices to get to the data we want displayed might not be as your database is organized, so a sample of, say 3 codes, which you pick because they look different, would suffice to develop the import technique. The various density functions will not be time dependent. Right now I don't see how time dependency gives a density function that is stable with an integration to 1. On the time dependent line, autocorrelation is probably the computational technique that would be most revealing.