German Hospital Data - Preview
This dataset tells half the story.
Introduction
Hey readers, I just wanted to let you know what I have been up to, since my substack hasn’t seen a lot of action in the past month.
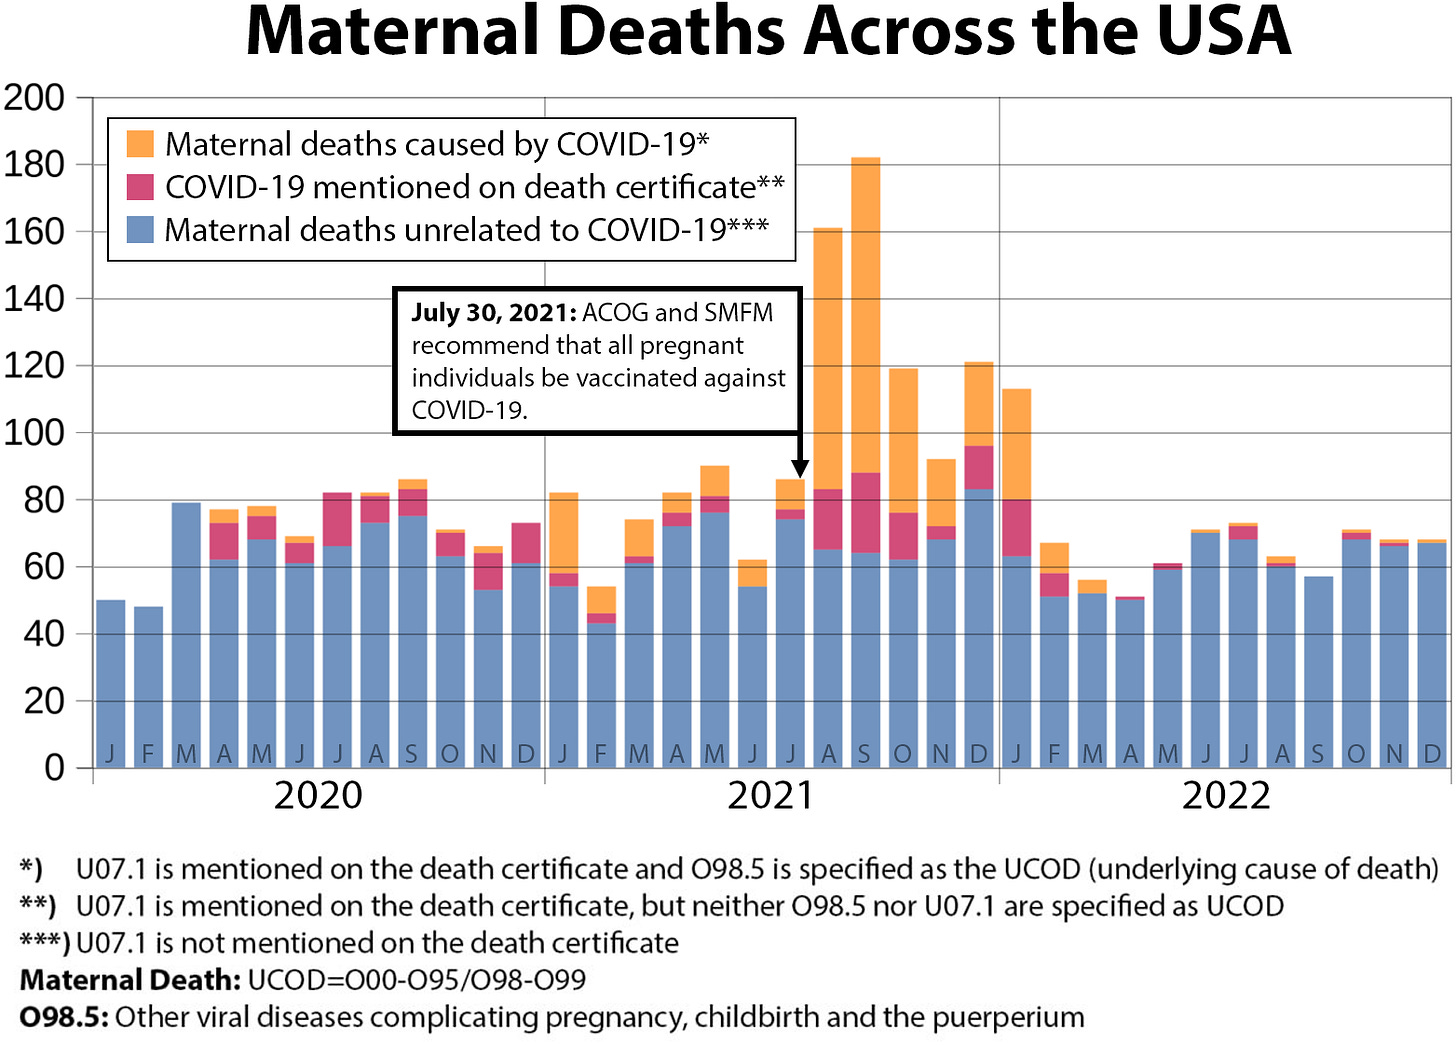
One thing I was busy with was trying to explain the US situation to a journalist (Mary Beth Pfeiffer) to push the maternal mortality story to the mainstream.
Mary Beth Pfeiffer is an uncommon gem—One of the last true journalists out there—Honest, fearless, and completely unswayed by the political narratives that rule most media these days.
I would second that.
She is trying hard to get the VMED story to the mainstream, after already succeeding to publish an article on excess mortality in The Hill - one that ranged in the Top 3 for 3 days.
Pierre Kory from the FLCCC Alliance (Front Line COVID-19 Critical Care Alliance) is helping her realize this. Alas, it is proving very difficult to get past the editors. It doesn’t look good.
Here is the gist of it:
Truth just doesn’t sell well…
German Hospitalization Data
The other thing that kept me busy is equally exciting.
I am building a German hospital dataset that will provide a lot of new insights. It takes up quite a bit of my time and costs me a bunch of money, but I think it’s worth it.
There are timeseries for around 40k keys (diagnoses, procedures etc.), each available for 16 age groups (plus all ages), both for deaths and cases (hospitalizations). I can also get additional datasets pre-filtered to my liking, e.g. by U07.1 diagnosis or by location (federal state).
Since building the dataset takes a long time, I have to limit myself to monthly resolution, but in theory it could reach daily resolution.
All timeseries are available by date of admission and by date of discharge. Date of admission means we can get accurate monthly CFR’s for all age groups and thousands of keys.
I will give you a few examples of the things I’ve already found just by drawing charts in LibreOffice. Some of the signals were found by Ulf Lorré and Tom Lausen, the latter of whom pointed out the data source to me, for which I am very grateful. If you don’t know him, google him. He is invaluable to the German fight for medical freedom.
Okay, here we go.
1. Vaccine injuries, classified as such
Assuming a baseline rate of 107 hospitalizations per month, that’s a cumulative 8,000 excess hospitalizations due to COVID vaccines.
These are just the ones…
…officially registered as vaccine injuries
…severe enough to require hospitalization (strictly speaking, hospitalization could be unrelated, but still…)
The background rate of 107 hospitalizations is also very interesting. These are due to other vaccines.
2. Ages 16-29: Cardiac MRI in resting state
This is for individuals aged 18-29:
And these are teenagers aged 16-17:
I have nothing to add here. You already know what happened.
3. Care and examination of lactating mothers
This is another interesting one.
Cases shot sky-high, reaching 100% excess in 2023. Strangely enough, Germany saw a decline in births around the same time…
So let’s look at the ratio of the two. I divided Z39.1 cases by the 12-month moving average of O80 cases for this chart:
The proportion grew by 70% throughout 2022 and more than doubled by mid-2023. There also is a bump in mid to late 2021 that looks interesting.
Impressive, isn’t it?
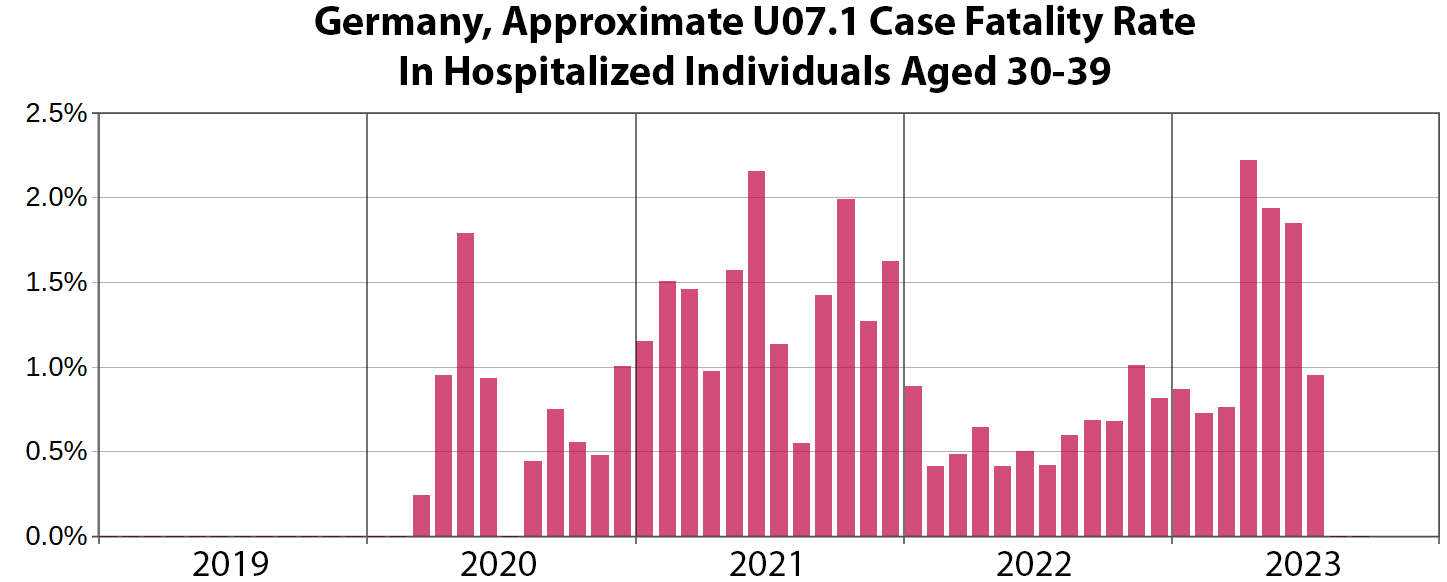
4. U07.1 CFR in individuals aged 30-39
These CFR’s are by date of discharge, so they aren’t accurate. Once I have the full dataset, I can do the same by date of admission, which will result in accurate CFR’s for all age groups.
The peak occurs around the time this subpopulation was vaccinated, confirming my previous findings based on US population-level data (VMED).
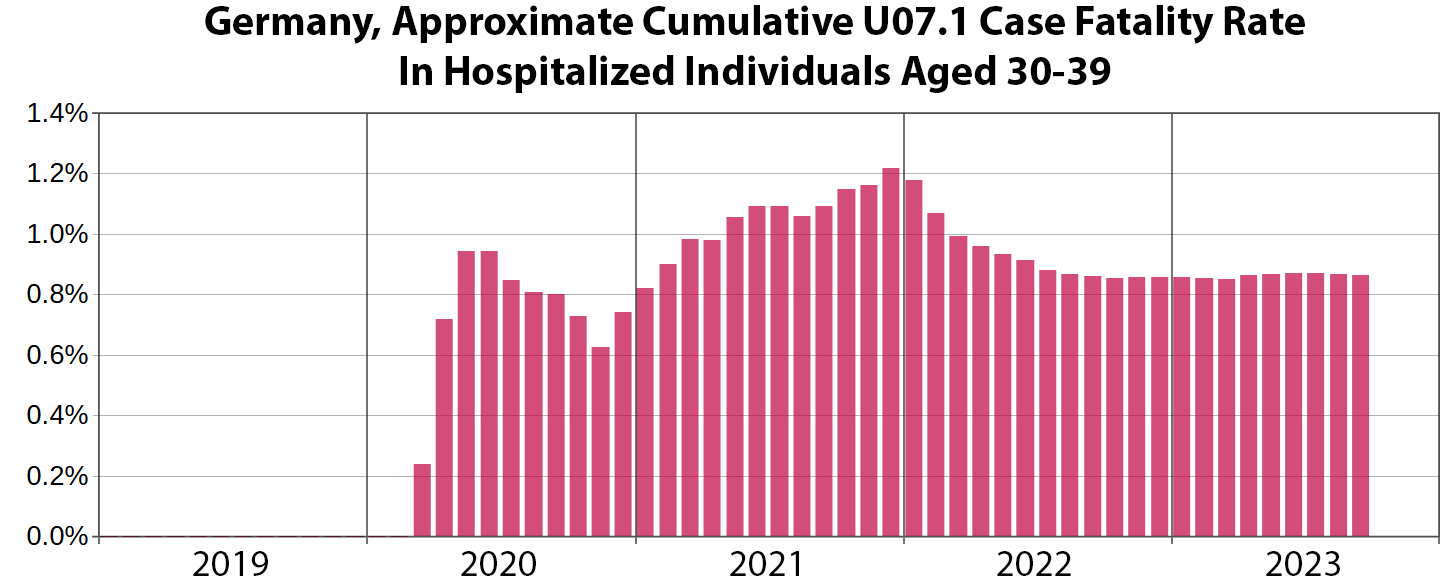
And we can also display the cumulative CFR, which is just the number of total deaths with a diagnosis of U07.1 divided by the number of total admissions with a diagnosis of U07.1.
It almost looks as if the COVID-19 case fatality rate kept rising all throughout 2021.
This is what the German public health agency Robert-Koch-Institut was trying to sell us (keep in mind these are all cases, not just hospitalized ones):
They intentionally covered the trend up by:
looking at entire years
using huge age groups (18-59)
employing incorrect rounding techniques
Rounding to one digit in 2020, but to two digits in 2021 and ending up with 0.1% vs. 0.12% could be anything from a 23.333% reduction to a 149.999% increase in CFR.
These devils take themselves for so clever, don’t they?
So yes, the RKI knew VMED was a thing and actively covered it up - just like the CDC did.
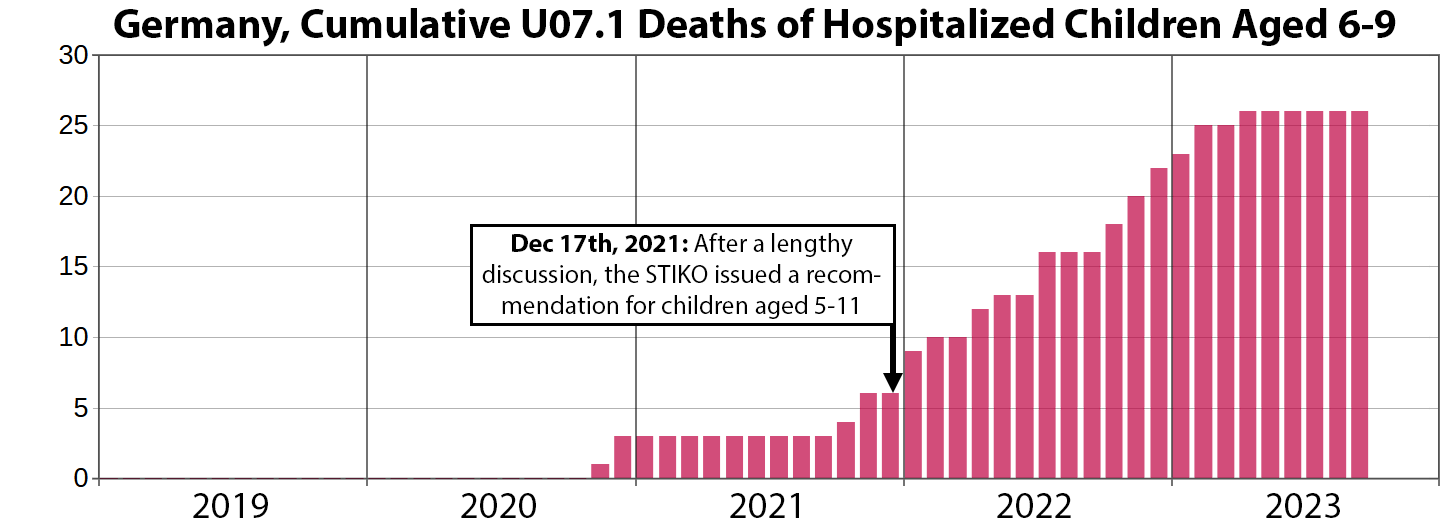
5. COVID deaths in children aged 6-9
On December 17th the German corrupted-to-the-bone vaccination commitee STIKO (Ständige Impfkomission) recommended the poison death shots to children aged 5-11. The discussion was all over the media in the preceding two months.
So let’s see what happened after they issued the recommendation…
But in 2022 Omicron took over, so COVID wasn’t the cause of these deaths, right? Well we can find out by limiting deaths to those children who also had a diagnosis for acute respiratory distress (J96.00).
Less deaths overall, but the pattern holds. As soon as children were turned into GMO’s, they started dying of COVID.
But hey - at least they didn’t murder their grandparents with their breathe, right?
Or did they?
6. Healthy individuals aged 80+ dying of COVID
It may sound paradox, but there are healthy 90 year olds out there. PCCL is short for “Patient Clinical Complexity Level”. It is based on an algorithm that uses comorbidities and other factors to assess the likelihood of complications among other things.
Patients with a PCCL of 0 are the healthiest of patients. They have much better chances of survival.
We already know, that only the frail died of COVID, right? Well let’s find out.
Ouch. However, let’s not jump to conclusions and put those figures in relation to all COVID hospital deaths occurring in this age group.
Something happened in January of 2021 that caused healthy people of advanced age to die of COVID.
7. The iatrogenesis hypothesis
There’s a very popular narrative which attributes COVID deaths to medical mistreatment.
I haven’t made up my mind on that. There is strong indication that SARS-CoV-2 was circulating in Europe in late 2019, without causing excess mortality.
A former friend of mine was in charge of a COVID unit. He is literally the worst non-psychiatrist doctor that I personally know. He just followed protocols, because he’s very insecure about his skills as a doctor.
With all the experimental pharmacotherapies (compassion trial etc.) and the excessive use of ventilators, it is plausible to assume treatment was suboptimal and caused avoidable deaths.
However, the question we should ask ourselves is this:
Were people who were misdiagnosed with COVID-19 (false positives) also killed by COVID treatment, e.g. because they didn’t receive proper diagnostics/therapy to identify and treat what really caused their symptoms and/or other signs of disease?
With my dataset we can find out. This is how:
I calculate the monthly CFR of patients with a diagnosis of U07.1
I calculate the monthly CFR of patients without a diagnosis of U07.1
I take the difference of the two
The proportion of false positives among SC2-positive individuals should rise when the SARS-CoV-2 prevalence drops
When SARS-CoV-2 prevalence is near zero, most U07.1 cases in hospital should be false positives
So let’s look at how the CFR difference is affected by SARS-CoV-2 prevalence. I will also present the 95% confidence intervals along with the spot estimates.
But first, monthly COVID incidence in hospitalized patients:
Both in the summer of 2020 and in the summer of 2021 SARS-CoV-2 prevalence must’ve been near zero.
And this is how that is reflected in the CFR difference between U07.1 patients and non-U07.1 patients. Instead of looking at all patients, we are only looking at isolated patients to make the two variables comparable.
We can see the CFR difference dropped all the way to insignificance (p>0.05) when SARS-CoV-2 prevalence was low.
So unless patients were actually infected with the virus, their chance of survival was the same as that of patients prophylactically isolated for other reasons.
Also take note of the huge CFR differences at the height of the waves. We are seeing an additional 1 in 7 hospitalized U07.1 patients die compared to non-U07.1 patients who were prophylactically isolated.
Notes
I will supply it to all the analysts I know and everyone else who asks me for it.
EDIT
As per reader request:







Saw this recently at my hospital.
https://open.substack.com/pub/dee746/p/covid-news-from-the-frontlines?r=1g1b1r&utm_campaign=post&utm_medium=web
In your fourth paragraph, eighth graph down, CFR of people 30-39 vs month/year, what do you make of the big upsurge in CFR in 2023? Wasn't the jab rate in Germany way down by 1/2023 in this age group? And this rise is preceded by a lower rate during 2022. I may have missed something obvious here.
I love your analyses. Maybe because the numbers somehow create an emotional distance from the tragic abuse inflicted with the "poison death shots". Thanks, Fabian.