
Just the Charts: COVID Mortality by Age Group
Monthly age-stratified COVID mortality based on public use death certificate files


Introduction
Some of the charts representing age-stratified COVID syndrome mortality will be part of the first long article about US mortality.
I do not want to clutter the article with all 20 of these, so I will instead link to this article.

Methods
I looked at all death certificates containing the code U071,
counted the deaths in each age group and month and then
calculated proportions
Data source
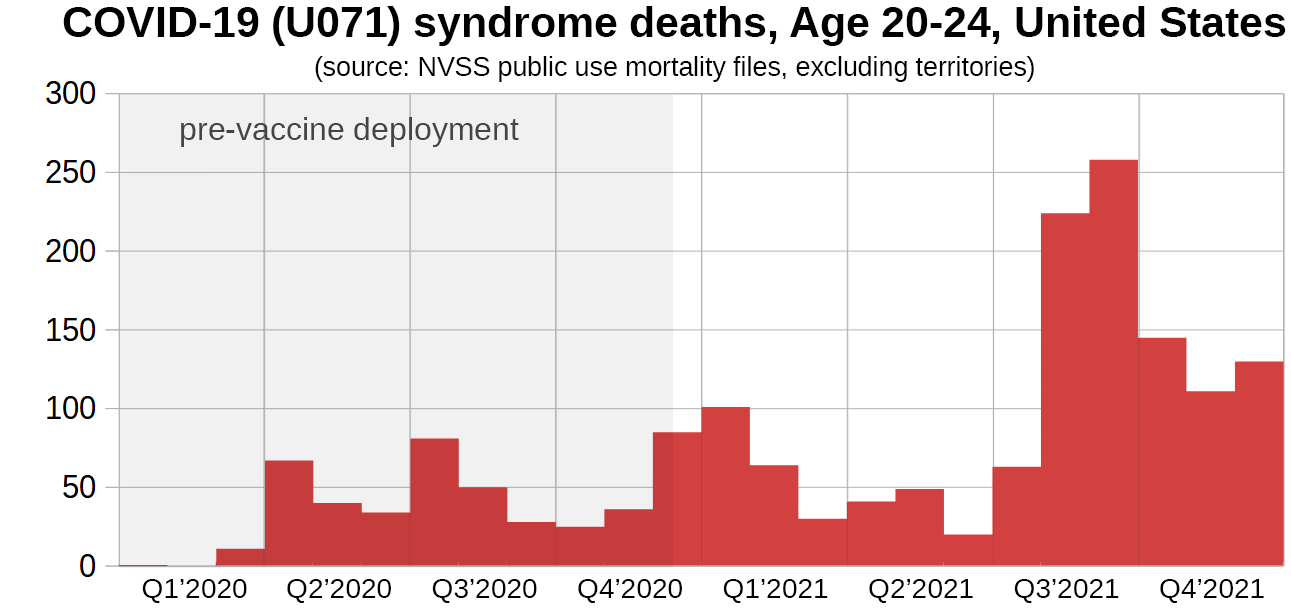
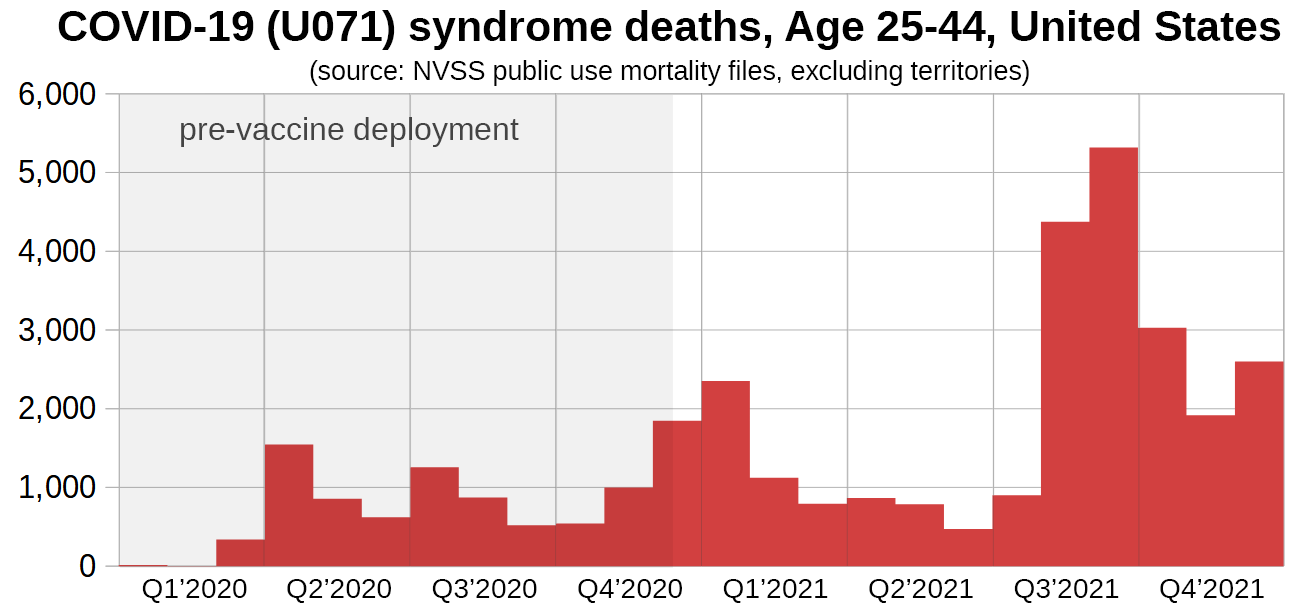
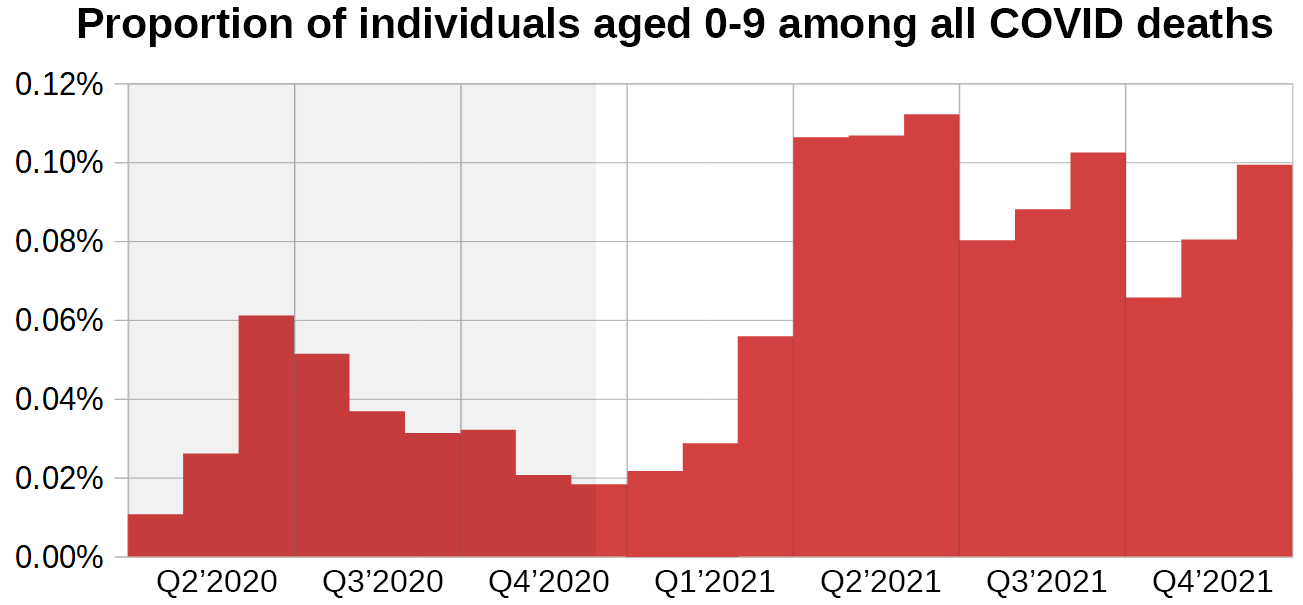
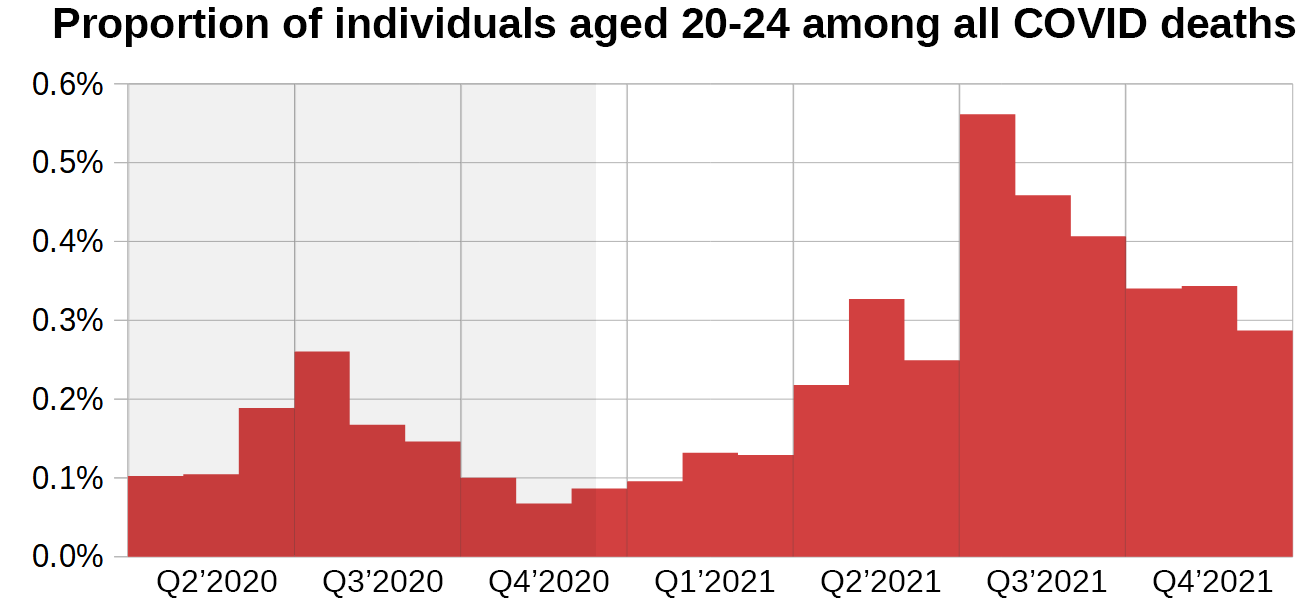
In the results section you will find both charts representing the absolute number of COVID syndrome deaths per month in various age groups and charts representing the proportion of each age group among the total number of monthly COVID syndrome deaths.
Results
Monthly number of deaths


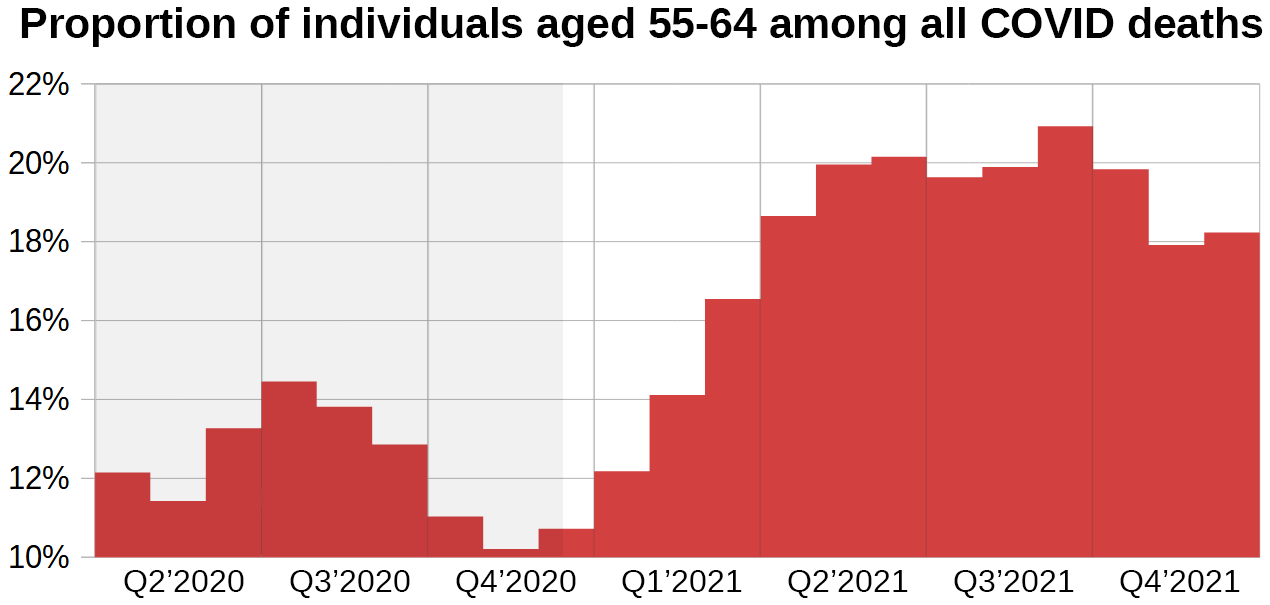
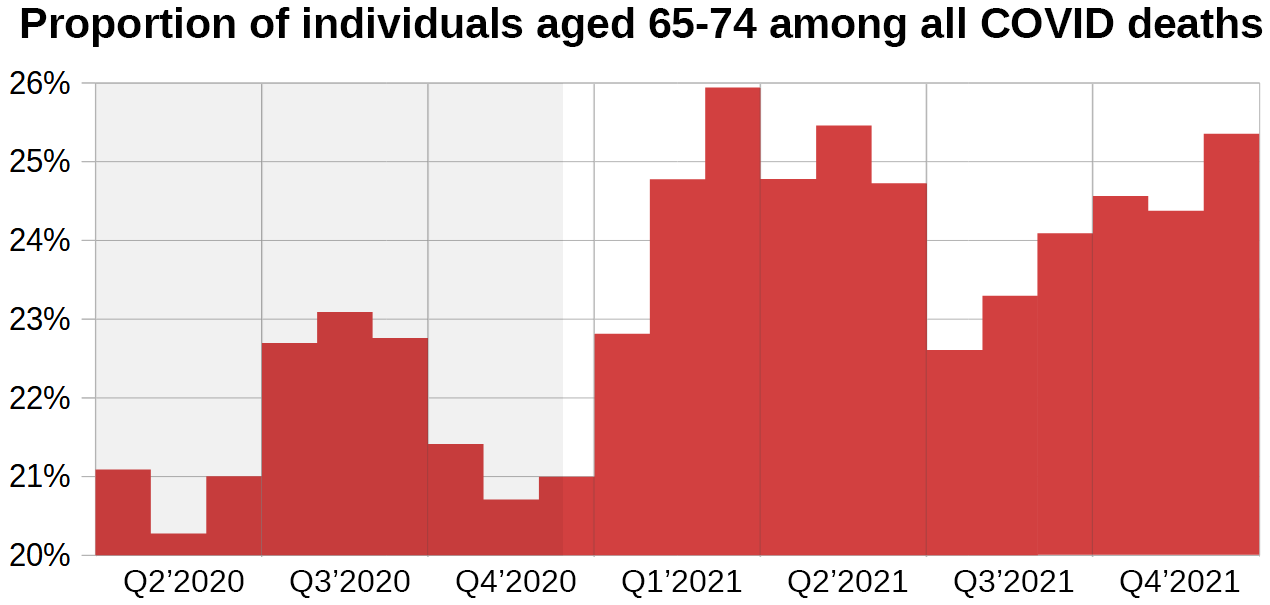
Proportions of age groups among deaths


Discussion
Initially I only looked at proportions and figured the younger cohorts are gaining because the older cohorts had higher rates of protection post-vaccination.
When I looked at the charts for the absolute number of COVID syndrome deaths it became clear that there is more to this. The younger the cohort, the higher the increase in the number of COVID syndrome deaths from 2020 to 2021.
Thank yuo for posting this Fabian.
Lot of hard work & time into getting the numbers graphed.
Horrendous facts emerging all the time.
I follow the Covid information and data like it’s my job. 😉 So I have reviewed a ton of posts like this. For me this is 💯 the best and most clear illustration of how deaths soared after the shots were implemented. Thank you.