
Incidence proportion ≈ report proportion
Further proof that report proportions of symptoms approximate their incidence proportions

Summary
For this article I compared the proportions of reports in the VAERS database containing various MedDRA terms with the incidence proportions of the symptoms they represent as specified in a Polish study based on a 19-question-questionnaire.
Our observations from the first article on this phenomenon are largely confirmed with a few exceptions, which we will look at in detail.
For the most common symptoms report proportions approximate incidence proportions.
Introduction
In another article I explained that for the most common symptoms patients experience after vaccination, the incidence proportions of symptoms are often very close to the report proportions.
This does not ring true for medical diagnoses or abnormalities in laboratory findings.
So in order to find out which medical concepts our rule of thumb applies to I compared incidence proportions from a survey conducted by a Polish team in early 2021 with report proportions of the respective MedDRA terms among VAERS reports.
In order to get a better understanding of what is going on, we have to ask ourselves what happens during the timespan between administration of the drug and filing of the report and what causes different types of terms to be included in adverse event reports. We will try to do that in the “Discussion” section of this article.
Methods
Since all patients were either working or studying and nobody had received their 3rd dose yet, I performed a VAERS search for reports about patients between the ages of 19 and 70 who have received either 1 or 2 doses of the COVID-19 vaccines.
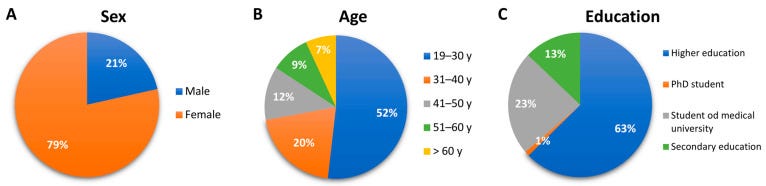
I then adjusted the resulting reports by applying weights according to the following characteristics of the Polish study groups:
sex (male: 0.21, female: 0.79)
age (19-30: 0.52, 31-40: 0.20, 41-50: 0.12, 51-60: 0.09, 61-70: 0.07)
doses received (1: 0.78, 2: 0.22)
documented virus-exposition (yes: 0.118, no: 0.882)
It should be noted that we were not able to adjust by education level, which is problematic.
We picked the following MedDRA terms to match the incidence proportions of symptoms determined by handing out the questionnaire:
Headache (headache)
Pyrexia (fever below 38°C)
Chills (chills)
Nausea (nausea)
Diarrhoea (diarrhea)
Cough (cough)
Vomiting (vomiting)
Alopecia (hair loss)
Syncope (fainting)
Presyncope (fainting)
Insomnia (insomnia)
Migraine (migraine)
Seizure (seizures)
Pain in Extremity (limb pain)
Fatigue (fatigue)
The adjusted report proportion of each MedDRA term was then plotted onto a bar chart next to the respective incidence proportion determined in the study.
To determine whether a term is overrepresented, underrepresented or equiproportionally represented, we calculate the 99% confidence intervals of the proportional ratio. If the confidence interval spans over 1, we consider the term equiproportionally represented.
Results

Equiproportionally represented:
Headache (PR with 95% CI: 0.836-0.929-1.034)
Pyrexia (PR with 95% CI: 0.861-0.971-1.010)
Chills (PR with 95% CI: 0.866-0.989-1.130)
Syncope (PR with 95% CI: 0.908-1.684-3.123)
Underrepresented:
Fatigue (PR with 95% CI: 0.401-0.430-0.461)
Pain in Extremity (PR with 95% CI: 0.167-0.175-0.183)
Seizure (PR with 95% CI: 0.167-0.245-0.360)
Insomnia (PR with 95% CI: 0.196-0.247-0.311)
Migraine (PR with 95% CI: 0.301-0.404-0.543)
Presyncope (PR with 95% CI: 0.232-0.431-0.801)
Alopecia (PR with 95% CI: 0.157-0.271-0.467)
Overrepresented:
Nausea (PR with 95% CI: 1.578-2.004-2.544)
Vomiting (PR with 95% CI: 2.181-3.746-6.434)
Diarrhoea (PR with 95% CI: 1.337-2.023-3.062)
Cough (PR with 95% CI: 1.642-2.673-4.351)
Discussion
It can be seen that the incidence proportion of 3 of the most common symptoms match the adjusted report proportion of those terms in VAERS.
Looking at the upper confidence levels (and point-estimates) it becomes apparent that six terms were underepresented by a factor of at least 1.2-2.8 (2.3-4.1) and one term/symptom - “Limb pain” / “Pain in Extremity” - was underepresented by a factor of at least 5.5 (5.7).
Looking at the lower confidence levels (and point-estimates) of the remaining four symptoms/terms, we can consider these terms overrepresented with factors of at least 1.3-2.2 (2.0-3.7).
Some of the under- and overrepresented terms stand out. We will discuss each to try and understand the reasons for the discrepancies.
Nausea/Vomiting/Diarrhoea/Cough
These four terms are all overrepresented symptoms of infectious disease. Since the study group consisted mainly of people employed or studying at a university hospital which we were not able to adjust our VAERS reports to, I can only assume that the discrepancies are explained by differences between the populations. Maybe hospital workers acquire greater resistance to the manifestation of these symptoms due to frequent exposure to infectious disease agents.
We also didn’t match the month/year in which injection was given. During different seasons, different pathogens can be encountered. It is possible that there was a relative lack of pathogenic infectious agents in early 2021 due to the social distancing measures implemented.
Fatigue + Insomnia
I also blame the discrepancies in the proportions for these terms on the demographic. Fatigue and insomnia are very common among hospital workers and students.
It is also possible that fatigue is simply severely underreported due to being so common. It was announced immediately upon introduction of the vaccines that post-vaccination fatigue is a very common symptom. This could lead to an unwilligness of doctors to mention it in reports, since they consider it a physiological reaction.
Such an expectation can also lead to patients not reporting the occurrence to their doctors. Additionally, I will just claim that most people have been tired at least once in the past month, so they might not attribute any new-onset tiredness to the administration of a drug.Pain in Extremity
This is a weird one.
My initial reaction was to blame the study design. If you design a questionnaire which specifically asks for the occurence of pain in the extremity after injecting a substance into the extremity, you are going to get a high response rate.
If on the other hand a patient spontaneously sees his doctor about side effects he experiences, I could see how “pain in the extremity” as a symptom is considered irrelevant and is hence not reported.
So to get some clarity on the issue, I looked into the study questionnaire, but it contained no mention of “pain” at all. The only question that came remotely close was:
“Did you experience the symptoms listed below […] Severe reaction at the injection site (swelling, redness and soreness)”
So without any clear understanding of how these data were collected, I can not comment on the discrepancy between the incidence proportion of “Limb pain” and the report proportion of “Pain in extremity”.
Conclusion
Ultimately I am interested in whether or not the report proportion of the term “Chest pain” is roughly equal to the incidence proportion of chest pain.
Considering the near-perfect match of the incidence and report proportions of other common symptoms like “Headache”, “Chills” or “Pyrexia”, I will keep assuming that “Chest pain” behaves very similarly to those terms.
While it is very hard to define a hard threshold for fatigue, it is very easy to do so for chest pain, headaches, fevers or chills. None of these symptoms occur physiologically, while fatigue can be present to varying degree due to lack of sleep or irregular sleeping schedules without having any pathological value in itself.
Great work... it is essential to get the numbers right..
the problem being that such surveys done by the Polish is that they provide leading questions that are not adequately scaled in severity and often exclude other symptoms..
My experience of “tiredness” extended over 3 weeks where I had to sleep for two to three hours every second day.. to me this is far from a mild reaction..it indicates systematic and extended release of the spike protein that my body was dealing with..
I also had weeping and mild pain in one eye that led to conjunctivitis in that eye that was cleared up with treatments..but the severity of the episode indicated that a second dose could cause significant swelling and weeping in both eyes..
And I got covid before the second dose ie at the 3 week mark..
The combination of vaccines and covid took another 6 weeks to resolve.. with ongoing fatigue requiring hours of sleep every day to recover.. at that point it was impossible to distinguish between the vac effects and covid..
Then the cumulative effects over multiple doses...?
However it is important to get real answers and it’s clear that the severe short term reaction are in the lower 5 %.. but the Dr Aseem M says 15% show heart symptoms and I certainly know 5-6 people who fit his categories, chest pain, persistent arrhythmia,
No one without comorbidities, and in there right mind would trade those risk for a bout of covid? But they do..